Gravity
Type of resources
Keywords
Publication year
Service types
Scale
Topics
-
<div>The National Measurement Institute’s (NMI) 550 kiloNewton (kN) force machine is a three-storey tall machine, made up of 56 tonnes of weights, installed at the NMI’s Lindfield laboratory in Sydney, NSW. It is Australia’s primary force standard and the highly precise forces it generates are used to provide a calibration service for force sensors and for customised testing. Calibrations performed with this machine underpin a wide range of critical measurements, ranging from the mass and centre of gravity of major airlines’ aircraft, to the strength of thousands of concrete samples tested daily around Australia.</div><div> Gravity measurements were requested by National Measurement Institute (NMI) to provide an accurate knowledge of the acceleration due to gravity, which is critical to determining the forces generated by the machine. Measurements were recorded using repeated loop measurements at the top and base of the machine, with measurements tied to the existing gravity benchmark “200498.9905” located in the barometry laboratory (room C269) which was also used to provide a measure of instrument drift. Measurements were performed over the course of one day on 23rd May 2024 using a Scintrex CG-5 relative gravimeter (Serial Number 40818).</div>
-
No abstract available
-
GADDS runs the JetStream software package created by Intrepid Geophysics Pty Ltd. GADDS was implemented for web-data delivery of Geoscience Australia's land gravity and airborne survey datasets in both grid and (point/line) vector data formats. GADDS works on geodetic magnetic and gravity grids of continental Australia as well as individual survey magnetic, radiometric and elevation datasets. Gravity point data from Australia is extracted from an Oracle database. The GADDS front-end application was developed in-house at Geoscience Australia by Aaron Sedgmen.
-
No abstract available
-
Gravity data measure small changes in gravity due to changes in the density of rocks beneath the Earth's surface. The gravity data collection contains both onshore and offshore data acquired on geophysical surveys conducted by Commonwealth, State & NT Governments and the private sector.
-
No abstract available
-
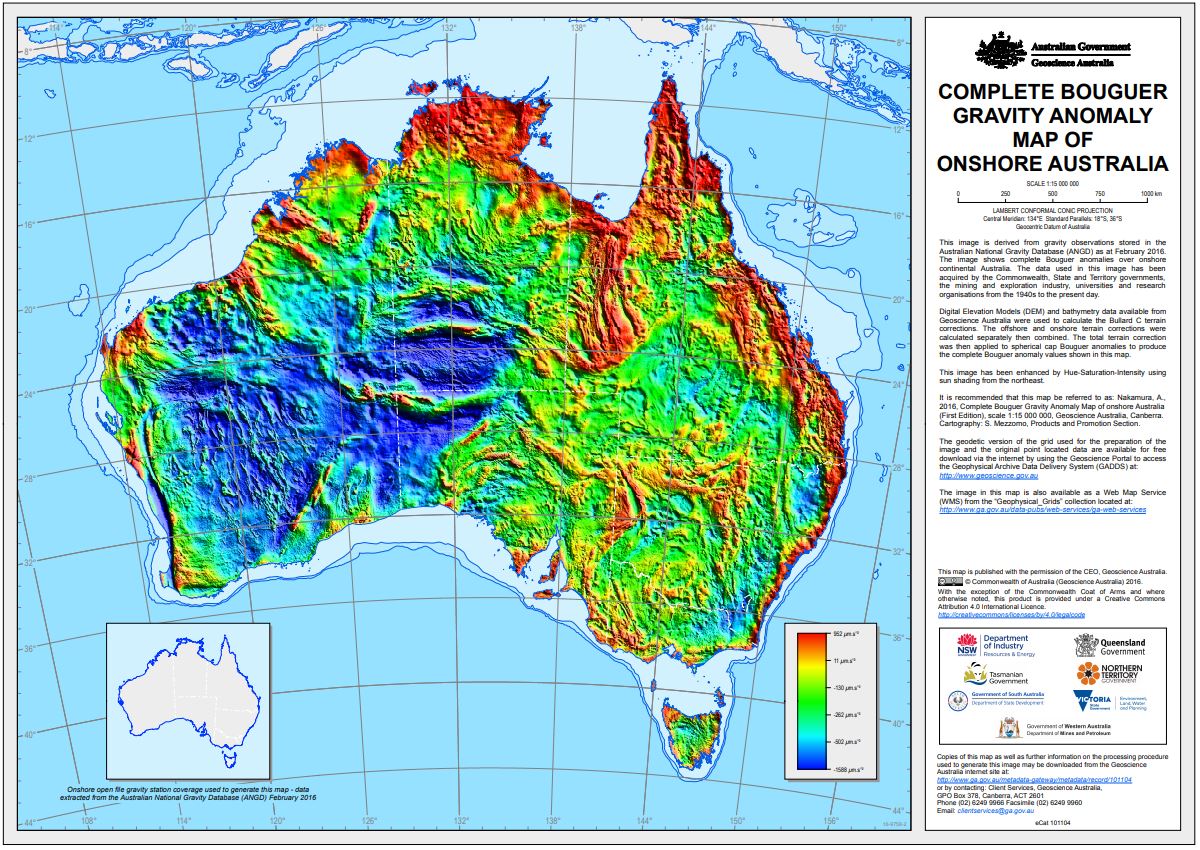
This gravity anomaly image has been derived from observations stored in the Australian National Gravity Database (ANGD) as at February 2016 as well as data from the 2013 New South Wales Riverina gravity survey. Out of the approximately 1.8 million gravity observations 1,371,998 gravity stations in the ANGD together with 19,558 stations from the Riverina survey were used to generate this image. The image shows complete Bouguer anomalies over onshore continental Australia. The data used in this image has been acquired by the Commonwealth, State and Territory Governments, the mining and exploration industry, universities and research organisations from the 1940's to the present day. Terrain corrections to gravity were calculated using both offshore bathymetry and onshore topography data. These terrain corrections were applied to the spherical cap Bouguer anomalies used in the Bouguer Gravity Anomaly Grid of Onshore Australia 2016 to produce the complete Bouguer anomalies shown in this image. The Complete Bouguer Gravity Anomaly Grid of Onshore Australia 2016 has been image enhanced and displayed as a hue-saturation-intensity (HSI) image with sun shading from the northeast to create this product.
-
No abstract available
-
No abstract available
-
No abstract available