Topography
Type of resources
Keywords
Publication year
Service types
Topics
-
This service represents a combination of two data products, the DEM_SRTM_1Second dataset and the Australian_Bathymetry_Topography dataset. This service was created to support the CO2SAP (Co2 Storage application) Project to create a transect elevation graph within the application. This data is not available as a dataset for download as a Geoscience Australia product. The DEM_SRTM_1Second service represents the National Digital Elevation Model (DEM) 1 Second product derived from the National DEM SRTM 1 Second. The DEM represents ground surface topography, with vegetation features removed using an automatic process supported by several vegetation maps. eCat record 72759. The Australian_Bathymetry_Topography service describes the bathymetry dataset of the Australian Exclusive Economic Zone and beyond. Bathymetry data was compiled by Geoscience Australia from multibeam and single beam data (derived from multiple sources), Australian Hydrographic Service (AHS) Laser Airborne Depth Sounding (LADS) data, Royal Australian Navy (RAN) fairsheets, the General Bathymetric Chart of the Oceans (GEBCO) bathymetric model, the 2 arc minute ETOPO (Smith and Sandwell, 1997) and 1 arc minute ETOPO satellite derived bathymetry (Amante and Eakins, 2008). Topographic data (onshore data) is based on the revised Australian 0.0025dd topography grid (Geoscience Australia, 2008), the 0.0025dd New Zealand topography grid (Geographx, 2008) and the 90m SRTM DEM (Jarvis et al, 2008). eCat record 67703. IMPORTANT INFORMATION For data within this service that lays out of the Australian boundary the following needs to be considered. This grid is not suitable for use as an aid to navigation, or to replace any products produced by the Australian Hydrographic Service. Geoscience Australia produces the 0.0025dd bathymetric grid of Australia specifically to provide regional and local broad scale context for scientific and industry projects, and public education. The 0.0025dd grid size is, in many regions of this grid, far in excess of the optimal grid size for some of the input data used. On parts of the continental shelf it may be possible to produce grids at higher resolution, especially where LADS or multibeam surveys exist. However these surveys typically only cover small areas and hence do not warrant the production of a regional scale grid at less than 0.0025dd. There are a number of bathymetric datasets that have not been included in this grid for various reasons.
-
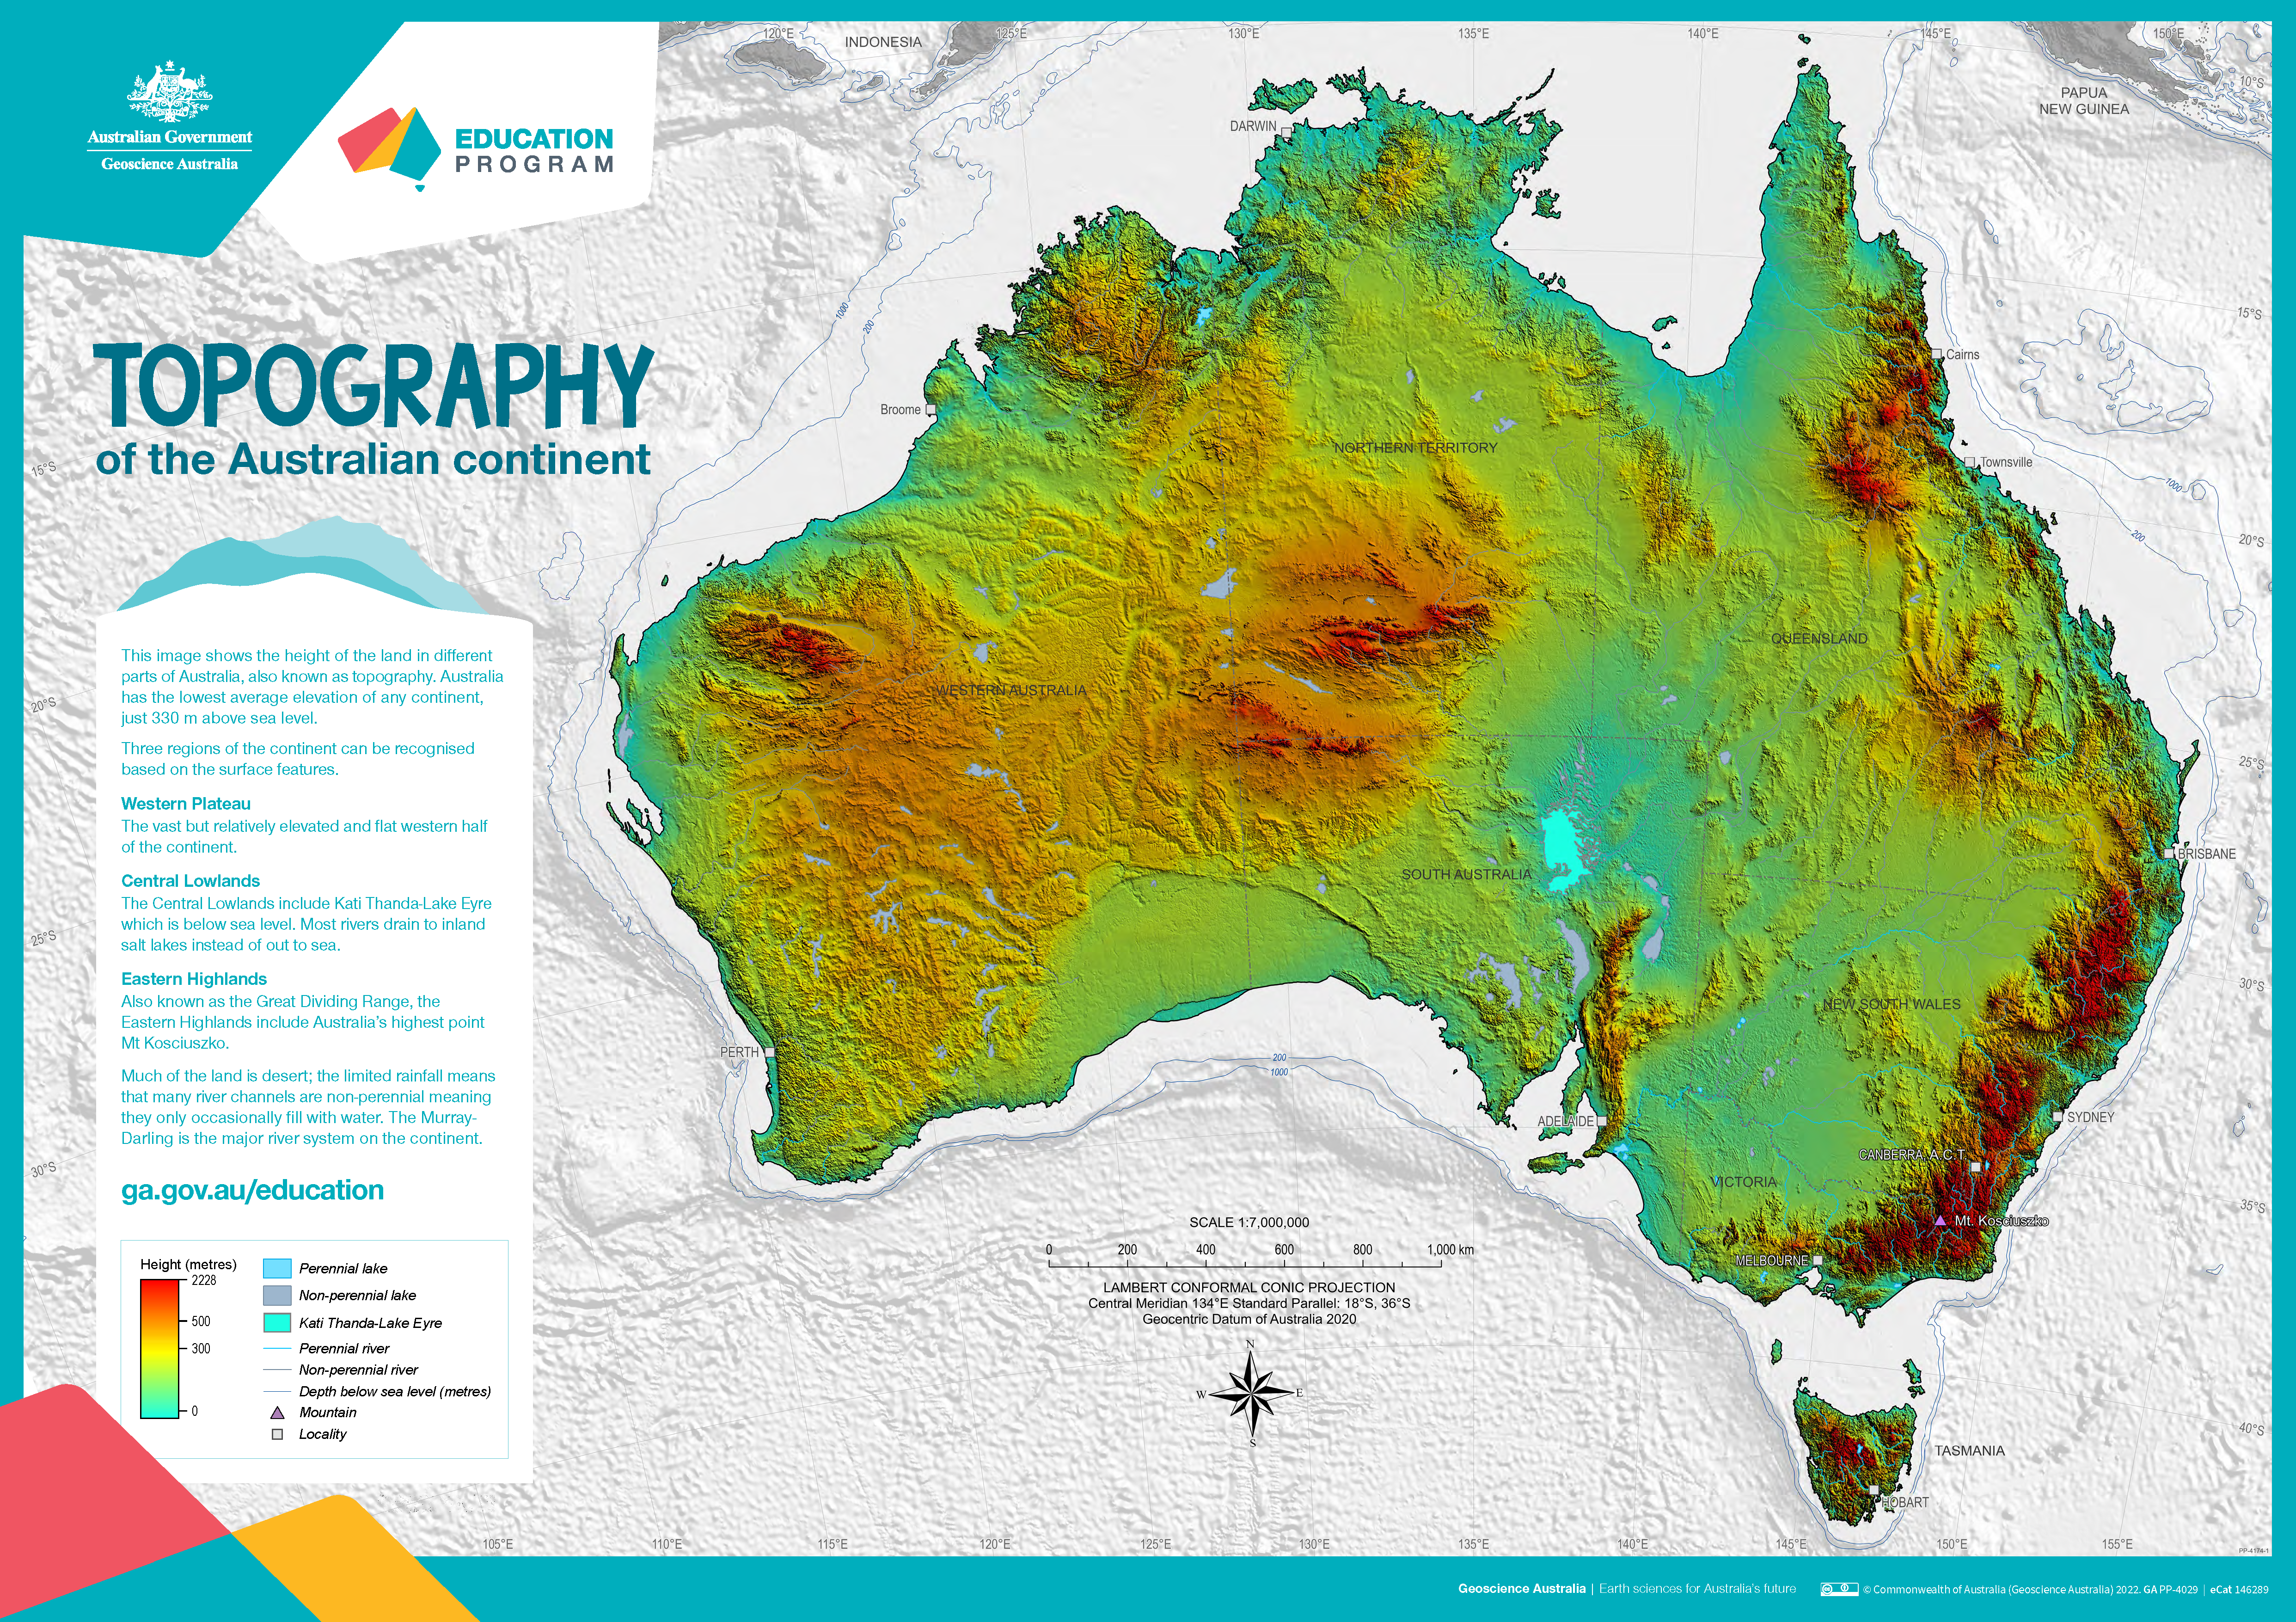
The poster uses a colourful digital elevation model to show the topography of the Australian continent. Low land is shown in green, higher land is yellow and orange and the highest parts of the country appear red. The map also shows perennial and non-perennial lakes and rivers as well as the location of the highest point in Australia and Kati Thanda-Lake Eyre at below sea level. The surrounding 200 m and 1000 m seabed depths contours are shown against a grey background. An accompanying text box outlines the three main physical regions of the county: the western plateau, central lowlands and eastern highlands. The poster is designed to be printed at A1 size which is 1:7 000 000 scale.
-
This service contains the topographic map indexes of 1:1 Million, 1:250,000 and 1:100,000 scale maps available from Geoscience Australia. These indexes drive the online topographic map index dashboards and contain value-add attributes, including a link to download the map. There are two 1:250,000 layers in the index; one layer which represents the new 1:250,000 AUSTopo Australian Digital Map Series index and one layer which represents the existing 1:250,000 scale index. The datasets for the 1:1 Million, 1:100,000 and existing 1:250,000 scale maps can be found in the eCat record 145830. The dataset for the 1:250,000 AUSTopo Australian Digital Topographic Map Series can be found in the eCat record 148692.
-
The National Base Map - without labels service provides seamless topographic colour mapping for the whole of Australia, including the outer islands of Norfolk, Lord Howe & Macquarie Islands, the external territories of Cocos (Keeling), Christmas, Heard and McDonald Islands and the Australian Antarctic Territory. The service consists of data sourced from Geoscience Australia, Australian Antarctic Division & OpenStreetMap. The data for Christmas Island has been sourced from the Christmas Island Edition 1 NATMAP Topographic Mapping dataset (1:30,000 scale). The data for Cocos (Keeling) Islands has been sourced from the Cocos (Keeling) Islands Edition 1 NATMAP Topographic Mapping dataset (1:25,000 scale). Vegetaion for the the Australian continent is an aggregated layer from ACLUMP (Australian Collaborative Land Use and Management Program). The topographic information was checked in 2008 using satellite imagery, and supplemented using other sources in 2009. Limited field checking has been undertaken for these data and therefore some information may not be accurate. Information and assistance was supplied by the Attorney General's Department (Territories of Australia) and Department of Environment, Water, Heritage and the Arts (Parks Australia). Geoscience Australia gratefully acknowledges contibutions to data content.) When viewing the map of mainland Australia beyond 1:100,000 scale, the data is derived from the Geoscience Australia GEODATA TOPO 250K product, except roads which are OpenStreetMap data, and in from 1:100,000 scale the data is derived from OpenStreetMap data ( © OpenStreetMap contributors). The suburbs layer is sourced from the Suburb 2018 and 2020 data, Australian Bureau of Statistics. The map portrays detailed graphic representations of features that appear on the Earth's surface. These features include cultural, hydrography, marine, transport, vegetation and relief themes. The SRTM data was acquired by NASA in February 2000 and was publicly released under Creative Commons licensing from November 2011 in ESRI Grid format. The SRTM DEM has quite different characteristics to DEMs derived by interpolation from topographic data. The SRTM data is derived from radar measurements that are dense (there is essentially a measurement at almost every grid cell) but noisy. The main processing of the SRTM DEM product has included: stripe removal, void filling and vegetation offset removal. Processing methods are further described in the 1 and 3 second SRTM Derived Products User Guide (Geoscience Australia, 2011). The bathymetry image used for this map is sourced from Natural Earth. Free vector and raster map data @ naturalearthdata.com. This version of the base map does not have any labelling associated with the map.
-
The Australian Topographic base map service is seamless national dataset coverage for the whole of Australia. The map is a representation of the Geoscience Australia 250k topographic specification and portrays a detailed graphic representation of features that appear on the Earth's surface. These features include cultural, hydrography and relief themes. The service contains layer scale dependencies.
-
Digital data is provided for the indexes of: - 1:100,000 scale topographic maps - 1:250,000 scale topographic maps - 1:1,000,000 scale General Reference maps These indexes are those used in the online map index dashboards and web maps. They contain value-add attributes, including map number, map name, map title, year published, the latitude and longitude of the extents of the maps sheets and data tiles covering Australia. They also include a link to download the map. Available in ESRI Shapefile and GDB.
-
This service represents a combination of two data products, the DEM_SRTM_1Second dataset and the Australian_Bathymetry_Topography dataset. This service was created to support the CO2SAP (Co2 Storage application) Project to create a transect elevation graph within the application. This data is not available as a dataset for download as a Geoscience Australia product. The DEM_SRTM_1Second service represents the National Digital Elevation Model (DEM) 1 Second product derived from the National DEM SRTM 1 Second. The DEM represents ground surface topography, with vegetation features removed using an automatic process supported by several vegetation maps. eCat record 72759. The Australian_Bathymetry_Topography service describes the bathymetry dataset of the Australian Exclusive Economic Zone and beyond. Bathymetry data was compiled by Geoscience Australia from multibeam and single beam data (derived from multiple sources), Australian Hydrographic Service (AHS) Laser Airborne Depth Sounding (LADS) data, Royal Australian Navy (RAN) fairsheets, the General Bathymetric Chart of the Oceans (GEBCO) bathymetric model, the 2 arc minute ETOPO (Smith and Sandwell, 1997) and 1 arc minute ETOPO satellite derived bathymetry (Amante and Eakins, 2008). Topographic data (onshore data) is based on the revised Australian 0.0025dd topography grid (Geoscience Australia, 2008), the 0.0025dd New Zealand topography grid (Geographx, 2008) and the 90m SRTM DEM (Jarvis et al, 2008). eCat record 67703. IMPORTANT INFORMATION For data within this service that lays out of the Australian boundary the following needs to be considered. This grid is not suitable for use as an aid to navigation, or to replace any products produced by the Australian Hydrographic Service. Geoscience Australia produces the 0.0025dd bathymetric grid of Australia specifically to provide regional and local broad scale context for scientific and industry projects, and public education. The 0.0025dd grid size is, in many regions of this grid, far in excess of the optimal grid size for some of the input data used. On parts of the continental shelf it may be possible to produce grids at higher resolution, especially where LADS or multibeam surveys exist. However these surveys typically only cover small areas and hence do not warrant the production of a regional scale grid at less than 0.0025dd. There are a number of bathymetric datasets that have not been included in this grid for various reasons.
-
The National Base Map - without labels service provides seamless topographic colour mapping for the whole of Australia, including the outer islands of Norfolk, Lord Howe & Macquarie Islands, the external territories of Cocos (Keeling), Christmas, Heard and McDonald Islands and the Australian Antarctic Territory. The service consists of data sourced from Geoscience Australia, Australian Antarctic Division & OpenStreetMap. The data for Christmas Island has been sourced from the Christmas Island Edition 1 NATMAP Topographic Mapping dataset (1:30,000 scale). The data for Cocos (Keeling) Islands has been sourced from the Cocos (Keeling) Islands Edition 1 NATMAP Topographic Mapping dataset (1:25,000 scale). Vegetaion for the the Australian continent is an aggregated layer from ACLUMP (Australian Collaborative Land Use and Management Program). The topographic information was checked in 2008 using satellite imagery, and supplemented using other sources in 2009. Limited field checking has been undertaken for these data and therefore some information may not be accurate. Information and assistance was supplied by the Attorney General's Department (Territories of Australia) and Department of Environment, Water, Heritage and the Arts (Parks Australia). Geoscience Australia gratefully acknowledges contibutions to data content.) When viewing the map of mainland Australia beyond 1:100,000 scale, the data is derived from the Geoscience Australia GEODATA TOPO 250K product, except roads which are OpenStreetMap data, and in from 1:100,000 scale the data is derived from OpenStreetMap data ( © OpenStreetMap contributors). The suburbs layer is sourced from the Suburb 2018 and 2020 data, Australian Bureau of Statistics. The map portrays detailed graphic representations of features that appear on the Earth's surface. These features include cultural, hydrography, marine, transport, vegetation and relief themes. The SRTM data was acquired by NASA in February 2000 and was publicly released under Creative Commons licensing from November 2011 in ESRI Grid format. The SRTM DEM has quite different characteristics to DEMs derived by interpolation from topographic data. The SRTM data is derived from radar measurements that are dense (there is essentially a measurement at almost every grid cell) but noisy. The main processing of the SRTM DEM product has included: stripe removal, void filling and vegetation offset removal. Processing methods are further described in the 1 and 3 second SRTM Derived Products User Guide (Geoscience Australia, 2011). The bathymetry image used for this map is sourced from Natural Earth. Free vector and raster map data @ naturalearthdata.com. This version of the base map does not have any labelling associated with the map.
-
The Australian Topographic base map service is seamless national dataset coverage for the whole of Australia. The map is a representation of the Geoscience Australia 250k topographic specification and portrays a detailed graphic representation of features that appear on the Earth's surface. These features include cultural, hydrography and relief themes. The service contains layer scale dependencies.
-
This service contains the topographic map indexes of 1:1 Million, 1:250,000 and 1:100,000 scale maps available from Geoscience Australia. These indexes drive the online topographic map index dashboards and contain value-add attributes, including a link to download the map. There are two 1:250,000 layers in the index; one layer which represents the new 1:250,000 AUSTopo Australian Digital Map Series index and one layer which represents the existing 1:250,000 scale index. The datasets for the 1:1 Million, 1:100,000 and existing 1:250,000 scale maps can be found in the eCat record 145830. The dataset for the 1:250,000 AUSTopo Australian Digital Topographic Map Series can be found in the eCat record 148692.