EFTF
Type of resources
Keywords
Publication year
Service types
Scale
Topics
-
The Layered Geology of Australia web map service is a seamless national coverage of Australia’s surface and subsurface geology. Geology concealed under younger cover units are mapped by effectively removing the overlying stratigraphy (Liu et al., 2015). This dataset is a layered product and comprises five chronostratigraphic time slices: Cenozoic, Mesozoic, Paleozoic, Neoproterozoic, and Pre-Neoproterozoic. As an example, the Mesozoic time slice (or layer) shows Mesozoic age geology that would be present if all Cenozoic units were removed. The Pre-Neoproterozoic time slice shows what would be visible if all Neoproterozoic, Paleozoic, Mesozoic, and Cenozoic units were removed. The Cenozoic time slice layer for the national dataset was extracted from Raymond et al., 2012. Surface Geology of Australia, 1:1 000 000 scale, 2012 edition. Geoscience Australia, Canberra.
-
This web service delivers metadata for onshore active and passive seismic surveys conducted across the Australian continent by Geoscience Australia and its collaborative partners. For active seismic this metadata includes survey header data, line location and positional information, and the energy source type and parameters used to acquire the seismic line data. For passive seismic this metadata includes information about station name and location, start and end dates, operators and instruments. The metadata are maintained in Geoscience Australia's onshore active seismic and passive seismic database, which is being added to as new surveys are undertaken. Links to datasets, reports and other publications for the seismic surveys are provided in the metadata.
-
One of the aims of the Exploring for the Future program is to promote the discovery of new mineral deposits in undercover frontiers. Iron oxide–copper–gold mineral systems are a desirable candidate for undercover exploration, because of their potential to generate large deposits with extensive alteration footprints. This mineral potential assessment uses the mineral systems concept: developing mappable proxies of required theoretical criteria, combined to demonstrate where conditions favourable for mineral deposit formation are spatially coincident. This assessment uses a 2D geographical information system workflow to map the favourability of the key mineral system components. Two outputs were created: a comprehensive assessment, using all available spatial data; and a coverage assessment, which is constrained to data that have no reliance on outcrop. The results of these assessment outputs were validated with spatial statistics, demonstrating how the assessment can predict the presence of known ore deposits. Both assessment outputs present new areas of interest with prospectivity in under-explored regions of undercover northern Australia. The intended aims are already being realised, as this tool has aided area selection for pre-competitive stratigraphic drilling as part of the MinEx CRC National Drilling Initiative. <b>Citation:</b> Murr, J., Skirrow, R.G., Schofield, A., Goodwin, J., Coghlan, R., Highet, L., Doublier, M.P., Duan, J. and Czarnota, K., 2020. Tennant Creek – Mount Isa IOCG mineral potential assessment. In: Czarnota, K., Roach, I., Abbott, S., Haynes, M., Kositcin, N., Ray, A. and Slatter, E. (eds.) Exploring for the Future: Extended Abstracts, Geoscience Australia, Canberra, 1–4.
-
The AusArray program aims to install small temporary passive seismic stations every 200 km across Australia. The seismic stations will passively measure small natural vibrations that travel through the Earth to help scientists understand the distribution and composition of rocks beneath the ground. Seismometers are sensitive instruments used to measure small natural vibrations that travel through the Earth caused by earthquakes, waves breaking on the shore and even wind. The data collected are analysed to create a three-dimensional model of the Earth’s subsurface. Passive seismic data can be used to model the Earth‘s structure, which is used to infer the geological history and assess the resource potential and natural hazards of the region.
-
This Record presents new Sensitive High Resolution Ion Micro Probe (SHRIMP) in situ monazite U–Pb geochronological results from the East Tennant area that were obtained in March 2022 as part of Geoscience Australia’s (GA) Exploring for the Future (EFTF) program. Three samples were targeted for monazite geochronology in order to constrain the timing of metamorphism and ductile deformation in the East Tennant area. Monazites in cordierite schist from the Alroy Formation in drill hole NDIBK01 (NDIBK01.300) yielded a weighted mean 207Pb/206Pb age of 1843.6 ± 6.1 Ma (95% confidence). Paragneiss from the Alroy Formation in drill hole NDIBK10 (NDIBK10.009) yielded monazites that returned a weighted mean 207Pb/206Pb crystallisation age of 1843.5 ± 5.1 Ma. Sparse monazites in sample NDIBK04.300, a garnet phyllite from drill hole NDIBK04, yielded a weighted mean 207Pb/206Pb crystallisation age of 1831 ± 28 Ma. These ages, from samples distributed throughout the East Tennant area, are interpreted to constrain the timing of an episode of low pressure, medium-grade metamorphism and coeval deformation.
-
The Officer Basin spanning South Australia and Western Australia is the focus of a regional stratigraphic study being undertaken as part of the Exploring for the Future (EFTF) program, an Australian Government initiative dedicated to increasing investment in resource exploration in Australia. Despite numerous demonstrated oil and gas shows, the Officer Basin remains a frontier basin for energy exploration with significant uncertainties due to data availability. Under the EFTF Officer-Musgrave Project, Geoscience Australia acquired new geomechanical rock property data from forty core samples in five legacy stratigraphic and petroleum exploration wells that intersected Paleozoic and Neoproterozoic aged intervals. These samples were subjected to unconfined compressive rock strength tests, Brazilian tensile strength tests and laboratory ultrasonic measurements. Petrophysical properties were also characterised via X-ray computerised tomography scanning, grain density and porosity-permeability analysis. Accurate characterisation of static geomechanical rock properties through laboratory testing is essential. In the modern exploration environment, these datasets are a precompetitive resource that can simplify investment decisions in prospective frontier regions such as the Officer Basin. Appeared in The APPEA Journal 62 S385-S391, 13 May 2022
-
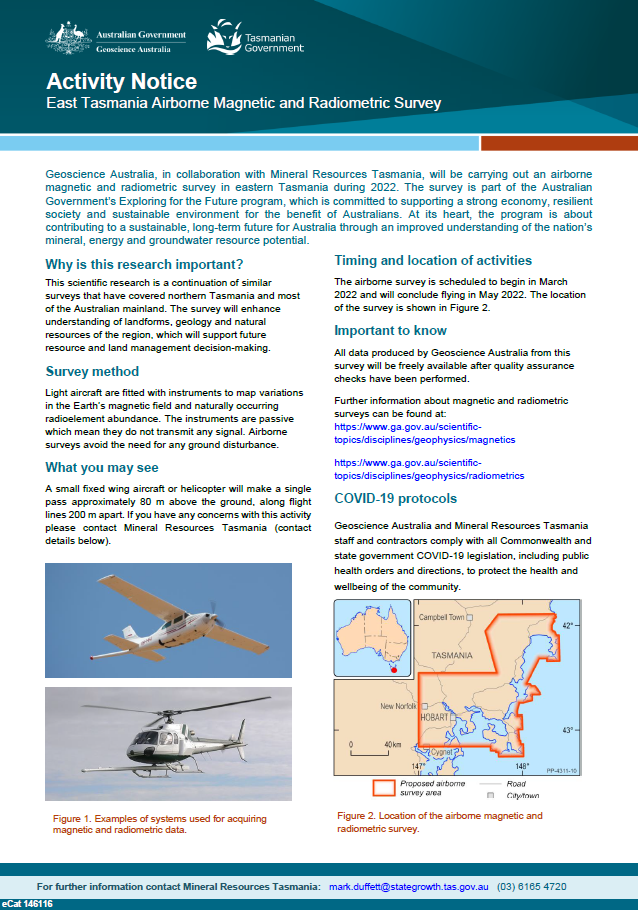
Geoscience Australia, in collaboration with Mineral Resources Tasmania, will be carrying out an airborne magnetic and radiometric survey in eastern Tasmania during 2022. The survey is part of the Australian Government’s Exploring for the Future program, which is committed to supporting a strong economy, resilient society and sustainable environment for the benefit of Australians. At its heart, the program is about contributing to a sustainable, long-term future for Australia through an improved understanding of the nation’s mineral, energy and groundwater resource potential. <p>
-
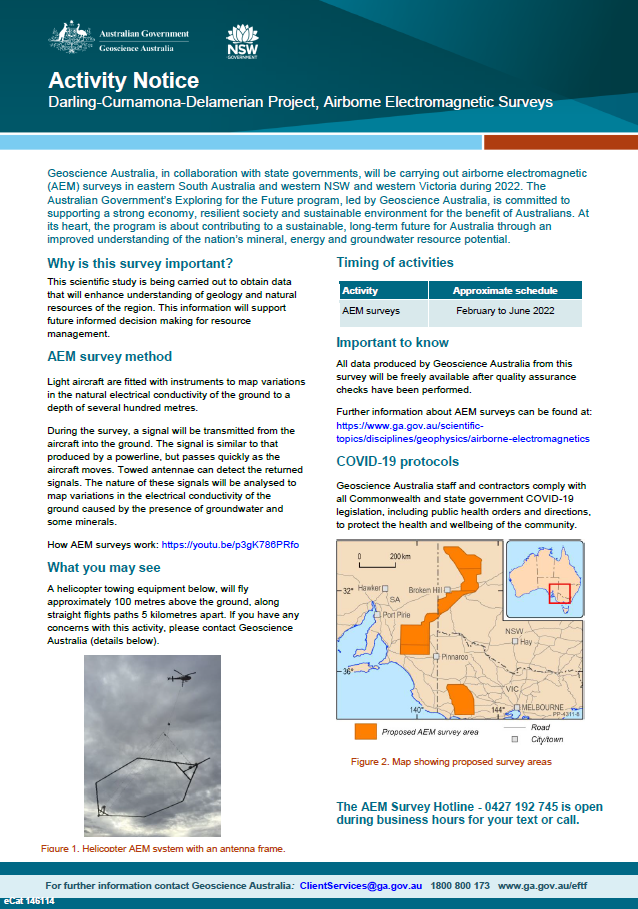
Geoscience Australia, in collaboration with state governments, will be carrying out airborne electromagnetic (AEM) surveys in eastern South Australia and western NSW and Victoria during 2022. The Australian Government’s Exploring for the Future program, led by Geoscience Australia, is committed to supporting a strong economy, resilient society and sustainable environment for the benefit of Australians. At its heart, the program is about contributing to a sustainable, long-term future for Australia through an improved understanding of the nation’s mineral, energy and groundwater resource potential <p>
-
Communities and ecosystems along the Darling River face critical water shortages and water quality issues including high salinity and algal blooms due to a reliance on declining surface water flows, which are impacted by extraction and drought, exacerbated by increases in temperature driven by climate change. The Darling River, characterised by highly variable flows, is the primary water source for the region and our understanding of the spatial extent and character of lower salinity groundwater within the surrounding Darling Alluvium, which could provide an alternative water source, is limited. Scientific understanding of the highly variable groundwater-surface water system dynamics of the Darling River is also an integral part of the evidence base required to manage the water resources of the wider Murray-Darling Basin, which has experienced critical water shortages for domestic and agricultural consumptive use and serious ecological decline due to reduced flows. Other relevant groundwater systems in the study area include aquifers of the underlying Eromanga and Surat Basins in the north, aquifers of the Murray Basin in the south, and fractured rock aquifers of the Darling Basin in the south-central area. Understanding of connectivity between these systems and the groundwater systems within the Darling Alluvium, and surface water of the Darling River, is also limited. Here we present the findings of a desktop analysis combining previous research with new analysis on water level, hydrochemistry, and Airborne Electromagnetic depth sections. This integration suggests that basement geometry and hydrostratigraphy within the Darling Alluvium are key structural controls on surface-groundwater connectivity, and the occurrence of a saline groundwater system within the lower part of the alluvium which impacts the quality of surface water and shallow alluvial groundwater resources. Further data acquisition and integrated analysis are planned to test these relationships as part of the Upper Darling Floodplain project. <b>Citation:</b> Buckerfield S., McPherson A., Tan K. P., Kilgour P. & Buchanan S., 2022. From Upper Darling Floodplain groundwater resource assessment. In: Czarnota, K. (ed.) Exploring for the Future: Extended Abstracts, Geoscience Australia, Canberra, https://dx.doi.org/10.26186/146847
-
Australia is the driest inhabited continent on Earth, and groundwater is crucial to supporting many urban and rural communities, economic activities and environmental values. Geoscience Australia, the nation’s trusted advisor on Earth Science, is renewing a deliberate focus on national-scale hydrogeological challenges within the Exploring for the Future program. This will be accomplished by building upon Geoscience Australia’s historic legacy in groundwater studies, including the development of the 1987 national hydrogeological map. Updating the extents, data and scientific understanding of the regions depicted in this map, and bringing it into a version suitable for access and use in the 21st century, will address many limitations of the existing map and its accompanying knowledge base. This compilation of information on Australia’s major hydrogeological regions, including both geospatial analyses of national datasets and high-level summaries of scientific literature, provides for a clear and consistent synthesis of hydrogeological and related contextual information. Supporting the delivery of the National Water Initiative and National Groundwater Strategic Framework, the inventory will benefit multi-sector water users (agriculture, communities, industry and tourism) and the environment. This work will also directly assist prioritisation and decision-making for future investment, and focus groundwater research in the work programs of Geoscience Australia and potentially inform national hydrogeological research more broadly. <b>Citation: </b>Lewis S. J., Lai E. C. S., Flower C. & Lester J. E., 2022. Towards a national information inventory of Australia’s major hydrogeological regions. In: Czarnota, K (ed.) Exploring for the Future: Extended Abstracts, Geoscience Australia, Canberra, https://dx.doi.org/10.26186/146974