Education
Type of resources
Keywords
Publication year
Scale
Topics
-
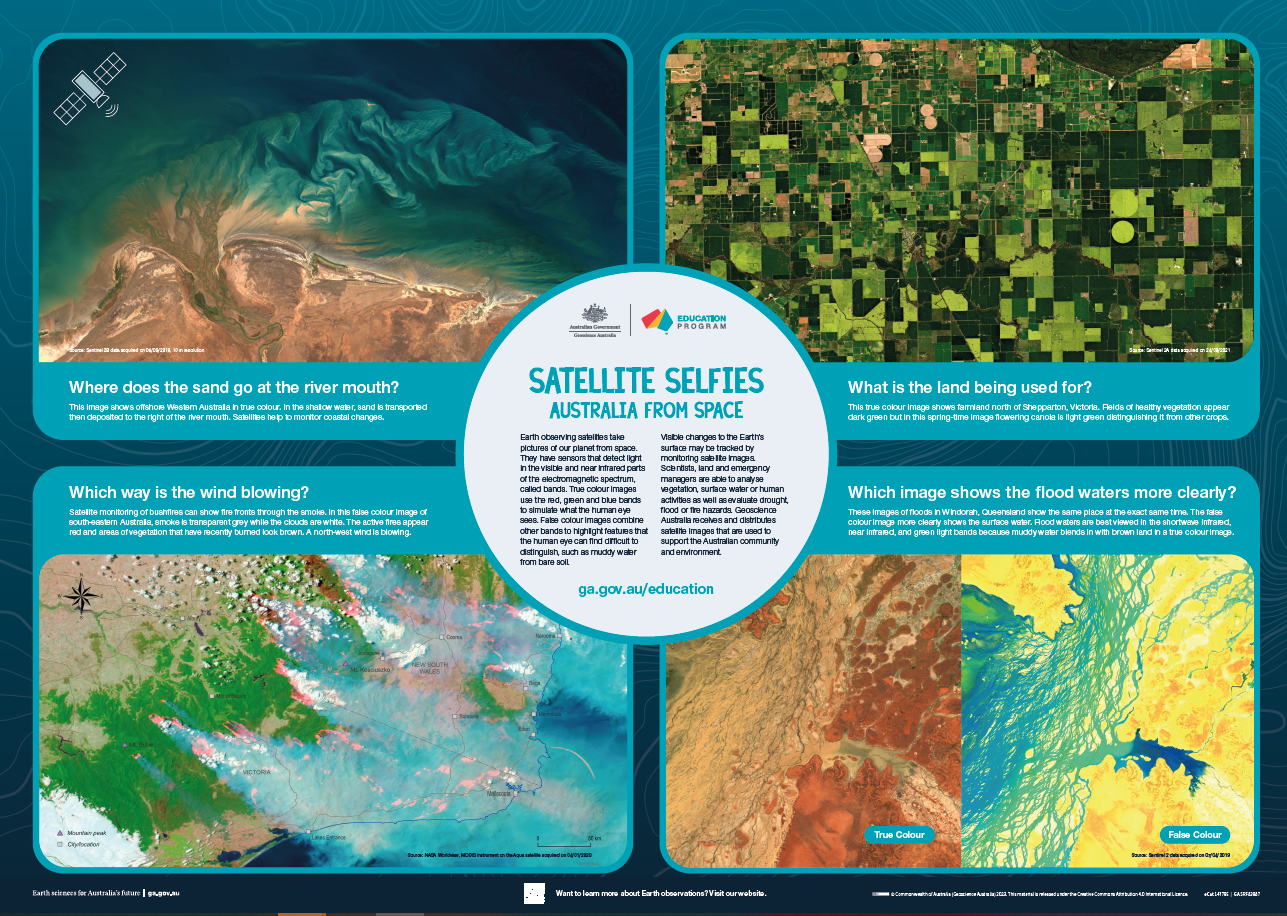
<div>The A1 poster incorporates 4 images of Australia taken from space by Earth observing satellites. The accompanying text briefly introduces sensors and the bands within the electromagnetic spectrum. The images include examples of both true and false colour and the diverse range of applications of satellite images such as tracking visible changes to the Earth’s surface like crop growth, bushfires, coastal changes and floods. Scientists, land and emergency managers use satellite images to analyse vegetation, surface water or human activities as well as evaluate natural hazards.</div>
-
Hamelin Pool and Lharidon Bight are separated from the open waters of Shark Bay by the Faure Sill - a wall of sand built by sea-grass banks. High evaporation rates increase the salinity of water in Hamelin Pool. Channels across the sill allow tidal exchange of surface waters, but water cannot be completely flushed from the shallow embayment. Microbes flourish because their competitors and predators are controlled by the low nutrient levels and high salinities (about twice that of normal sea water). Stromatelites grow around the margins of Hamelin Pool - in waters less than four metres deep - where sufficient concentrations of ions exist to promote calcification. As no rivers flow into Hamelin Pool, these slow growing structures are not swamped by sediment
-
This booklet focuses on volcanoes, their formation process, types, shapes, locations and effects on their surroundings. Significant volcano events around the world are covered, and special emphasis is placed on the Australian volcanic landscape. Student activities included. Recommended for Years 6 and 9.
-
This bulk set comprises 10 sets of 5 image cards. The cards are the same as the single set of cards included in both the Discovering Remote Sensing kit and each student manual in the Discovering Remote Sensing bulk set (purchased separately). The image cards are used with the student activitities in each of the latter two Remote Sensing resources. Suitable for secondary years 8-12
-
Handout about the SHRIMP instrument for visitors to GA SHRIMP Lab.
-
This set of 15 Australian landslide images on CD-ROM with accompanying explanatory text illustrates the causes of landslides and other earth movements. Learn how people contribute to creating and mitigating such events. Landslide images include Thredbo, NSW, Sorrento Vic., Gracetown WA and Tasmania. Suitable for secondary level Years 7-12.
-
Discussion of available stratigraphic resources: the Australian Stratigraphic Units Database (ASUD); documentation of procedures for modifying existing units or establishing new ones; contact details for the Australian Stratigraphy Commission members and ASUD staff. Suggestions on ways of raising awareness through modern media such as a podcast or app, and a request for feedback on what sort of approach might appeal to a university student audience.
-
Presentation for the National Science Week 2013, AMOS Seminar "The 2003 Canberra fires - 10 years after: What have we learned" 1-5pm CSIRO Discovery Centre 18 August 2013
-
This Australian volcanoes image set comprises 15 images on CD-ROM with accompanying descriptive text and student question/s for each image. Learn the history of Australia's hot spot volcanoes over 60 million years and examine 9 Australian volcanoes in detail. Suitable for primary levels Years 5-6 and secondary levels Years 7-10
-
Developed in consultation with Emergency Management Australia (EMA), this kit defines and maps major hazards affecting Australia - earthquakes, tsunamis, landslides, volcanoes, severe storms, cyclones, bushfires, floods and droughts. This kit helps students and teachers recognise risks from different natural hazards and the practical steps we can all take to reduce their effects. The Australian Natural Hazards Education Map Kit contains: - eight colour A3 poster maps with descriptive text - eight blackline A4 map masters - background information on each hazard - student activities - Emergency Management Australia hazard action cards Suitable for primary years 5-6 and secondary years 7-8.

