Exploring for the Future
Type of resources
Keywords
Publication year
Service types
Topics
-
The Upper Burdekin Chloride Mass Balance Recharge web service depicts the recharge rates have been estimated at borehole locations in the Nulla and McBride basalt provinces. Using rainfall rates, rainfall chemistry and groundwater chemistry, the recharge rates have been estimated through the Chloride Mass Balance approach.
-
This Record presents new Sensitive High Resolution Ion Micro Probe (SHRIMP) in situ monazite U–Pb geochronological results from the East Tennant area that were obtained in March 2022 as part of Geoscience Australia’s (GA) Exploring for the Future (EFTF) program. Three samples were targeted for monazite geochronology in order to constrain the timing of metamorphism and ductile deformation in the East Tennant area. Monazites in cordierite schist from the Alroy Formation in drill hole NDIBK01 (NDIBK01.300) yielded a weighted mean 207Pb/206Pb age of 1843.6 ± 6.1 Ma (95% confidence). Paragneiss from the Alroy Formation in drill hole NDIBK10 (NDIBK10.009) yielded monazites that returned a weighted mean 207Pb/206Pb crystallisation age of 1843.5 ± 5.1 Ma. Sparse monazites in sample NDIBK04.300, a garnet phyllite from drill hole NDIBK04, yielded a weighted mean 207Pb/206Pb crystallisation age of 1831 ± 28 Ma. These ages, from samples distributed throughout the East Tennant area, are interpreted to constrain the timing of an episode of low pressure, medium-grade metamorphism and coeval deformation.
-
The Tasselled Cap Wetness (TCW) percentage exceedance composite represents the behaviour of water in the landscape, as defined by the presence of water, moist soil or wet vegetation at each pixel through time. The summary shows the percentage of observed scenes where the Wetness layer of the Tasselled Cap transform is above the threshold, i.e. where each pixel has been observed as ‘wet’. Areas that retain surface water or wetness in the landscape during the dry season are potential areas of groundwater discharge and associated GDEs. The TCW exceedance composite was classified into percentage intervals to distinguish areas that were wet for different proportions of time during the 2013 dry season. Areas depicted in the dataset have been exaggerated to enable visibility.
-
Groundwater-dependent ecosystems (GDEs) rely on access to groundwater on a permanent or intermittent basis for some or all of their water requirements (Queensland Government, 2018). Remotely sensed data from Digital Earth Australia (DEA) (Geoscience Australia, 2018) were used to map potential aquatic and other GDEs and enhance understanding of surface water – groundwater interactions in the Upper Burdekin region. Two Landsat TM satellite products (Water Observations from Space (WOfS; Mueller et al. 2016) summary statistic and Tasselled Cap Index (TCI) wetness summary)) were used to investigate the persistence of surface water and soil moisture in the landscape to identify perennial streams, springs and other parts of the landscape that may rely on groundwater discharge. The WOfS summary statistic represents, for each pixel, the percentage of time that water is detected at the surface relative to the total number of clear observations. Due to the 25-m by 25-m pixel size of Landsat data, only features at least 25 m wide are detected and only features covering multiple pixels are consistently detected. The WOfS summary statistic was produced over the McBride and Nulla Basalt provinces for the entire period of available data (1987 to 2018). Pixels were polygonised and classified in order to visually enhance key data in the imagery, such as the identification of standing water for at least 80% of the time. The TCI is a method of reducing six surface reflectance bands of satellite data to three bands (Brightness, Greenness, Wetness) using a Principal Components Analysis (PCA) and Procrustes' Rotation (Roberts et al., 2018). The published coefficients of Crist (1985) are applied to DEA's Landsat data to generate a TCI composite. The resulting Tasselled Cap bands are a linear combination of the original surface reflectance bands that correlate with the Brightness (bare earth), Greenness and Wetness of the landscape. The TCI wetness summary (or Tasselled Cap Wetness (TCW) percentage exceedance composite), derived from the Wetness band, represents the behaviour of water in the landscape, as defined by the presence of water, moist soil or wet vegetation at each pixel through time. The summary shows the percentage of observed scenes where the Wetness layer of the Tasselled Cap transform is above the threshold, i.e. where each pixel has been observed as ‘wet’ according to the TCI. Areas that retain surface water or wetness in the landscape during the dry season are potential areas of groundwater discharge and associated GDEs. The TCW threshold is set at -600 to calculate the percentage exceedance. This threshold is based on scientific judgment and is currently in the research/testing phase. It is based on Australian conditions and conservative in nature. The dry season, when surface runoff to streams and rainfall are minimal, is particularly useful for identifying and mapping groundwater-fed streams, springs and other ecosystems that rely on access to groundwater during periods of limited rainfall. The Upper Burdekin region was especially dry between May and October 2013, with low rainfall totals in the months preceding this dry season and overall below-average rainfall conditions (i.e. decline in rainfall residual mass). The TCW exceedance composite was classified into percentage intervals to distinguish areas that were wet for different proportions of time during the 2013 dry season. Field validation of the remote sensing data products would be required to confirm the preliminary identification of parts of the landscape where groundwater discharges to the surface and potentially supports GDEs. This release includes the classified WOfS summary statistic and classified TCW percentage exceedance composite (May-October 2013) data products for the McBride and Nulla basalt provinces in the Upper Burdekin region, North Queensland. <b>References: </b> Crist EP (1985) A TM Tasseled Cap equivalent transformation for reflectance factor data. Remote Sensing of Environment 17(3), 301–306. Doi: 10.1016/0034-4257(85)90102-6. Geoscience Australia (2018) Digital Earth Australia. Geoscience Australia, http://www.ga.gov.au/dea. Mueller, N., Lewis, A., Roberts, D., Ring, S., Melrose, R., Sixsmith, J., Lymburner, L., McIntyre, A., Tan, P., Curnow, S. and Ip, A. (2016) Water observations from space: Mapping surface water from 25 years of Landsat imagery across Australia. Remote Sensing of Environment 174, 341-352, ISSN 0034-4257. Queensland Government (2018) Groundwater dependent ecosystems, WetlandInfo 2014. Queensland Government, Brisbane, https://wetlandinfo.des.qld.gov.au/wetlands/ecology/aquatic-ecosystems-natural/groundwater-dependent/. Roberts D, Dunn B and Mueller N (2018) Open Data Cube Products Using High-Dimensional Statistics of Time Series. International Geoscience and Remote Sensing Symposium. Valencia, Spain: IEEE Geoscience and Remote Sensing Society.
-
In October 2020 the Exploring for the Future program held a series of workshops to seek input and feedback on the plans for the second phase of the program. This presentation was used in the open workshops held with industry stakeholders.
-
Borehole induction conductivity (IC) and gamma logging are geophysical techniques that provide bulk electrical conductivity and natural gamma trends of geological formations. The measured unit of IC is millisiemens per metre, whereas natural gamma is either counts per second or American Petroleum Index (API). The data were acquired as part of the Exploring for the Future program at field sites within the East Kimberley area in Western Australia, and the northern and southern Stuart Corridor projects in the Northern Territory. Data may be downloaded as Log ASCII Standard (LAS) format files or viewed through the Geoscience Australia Portal, or accessed via Geoscience Australia’s WMS and WFS web services.
-
Exploring for the Future (EFTF) is an Australian Government program led by Geoscience Australia (GA), in partnership with state and Northern Territory governments. The EFTF program (2016-2024) aims to drive industry investment in resource exploration in frontier regions of onshore Australia by providing new precompetitive data and information about their energy, mineral and groundwater resource potential. Under the EFTF program, the Onshore Energy Project undertook a study of petroleum prospectivity of the onshore Officer Basin in South Australia and Western Australia. Yowalga 3 well in Western Australia was selected based on the occurrence of gas and oil shows reported in the well completion report. Sampling of cuttings and cores was done at Geoscience Australia's Petroleum Data Repository in Canberra. Geoscience Australia commissioned a fluid inclusion stratigraphy (FIS) study on the downhole samples. Here, volatile components ostensibly trapped with fluid inclusions are released and analysed revealing the level of exposure of the well section to migrating fluids. Integration of thin section (TS) preparations reveal to extent of gas and fluid trapping within fluid inclusions while microthemometry (MT) gives an estimation of fluid inclusion trapping temperature. For Yowalga 3, FIS analysis was performed on 698 cuttings and 30 cores between 140 metres and 3526 metres base depth, together with 22 samples prepared for TS. To support this study, lithostratigraphic tops were compiled by Geoscience Australia. The results of the study are found in the accompanying documents. Note: Yowalga 3 results are in two parts, Part 1 and Part 2, since the total number of samples exceeded to maximum number of samples (575) for a Schlumberger well report. Part 1 has cuttings by increasing depth and Part 2 has the remaining cuttings then the cores.
-
Newer version v1.1 available at eCat <a href="https://pid.geoscience.gov.au/dataset/ga/147720">147720</a> Isotopic data from rocks and minerals have the potential to yield unique insights into the composition and evolution of the Earth's crust and mantle. Time-integrated records of crust and mantle differentiation (as preserved by the U-Pb, Sm-Nd and Lu-Hf isotopic systems, for example) are important in a wide range of geological applications, especially when successfully integrated with other geological, geophysical, and geochemical datasets. However, such integration requires (i) compilation of comprehensive isotopic data coverages, (ii) unification of datasets in a consistent structure to facilitate inter-comparison, and (iii) easy public accessibility of the compiled and unified datasets in spatial and tabular formats useful and useable by a broad range of industry, government and academic users. This constitutes a considerable challenge, because although a wealth of isotopic information has been collected from the Australian continent over the last 40 years, the published record is fragmentary, and derived from numerous and disparate sources. Unlocking and harnessing the collective value of isotopic datasets will enable more comprehensive and powerful interpretations, and significantly broaden their applicability to Earth evolution studies and mineral exploration. As part of the Exploring for the Future (EFTF) program (https://www.ga.gov.au/eftf), we have designed a new database structure and web service system to store and deliver full Lu-Hf isotope and associated O-isotope datasets, spanning new data collected during research programs conducted by Geoscience Australia (GA), as well as compiled literature data. Our approach emphasises the links between isotopic measurements and their spatial, geological, and data provenance information in order to support the widest possible range of uses. In particular, we build and store comprehensive links to the original sources of isotopic data so that (i) users can easily track down additional context and interpretation of datasets, and (ii) generators of isotopic data are appropriately acknowledged for their contributions. This system delivers complete datasets including (i) full analytical and derived data as published by the original author, (ii) additional, normalised derived data recalculated specifically to maximise inter-comparability of data from disparate sources, (iii) metadata related to the analytical setup, (iv) a broad range of sample information including sampling location, rock type, geological province and stratigraphic unit information, and (v) descriptions of (and links to) source publications. The data is delivered through the Geoscience Australia web portal (www.portal.ga.gov.au), and can also be accessed through any web portal capable of consuming Open Geospatial Consortium (OGC)-compliant web services, or any GIS system capable of consuming Web Map Services (WMS) or Web Feature Services (WFS). This Record describes the database system and web service tables. It also contains full tabulated datasets for data compiled from the North Australian Craton as part of the EFTF program. These data are predominantly micro-analytical zircon analyses which are linked at the spot-level across Lu-Hf, O, and U-Pb measurements. This data release comprises 5974 individual analyses from 149 unique rock samples.
-
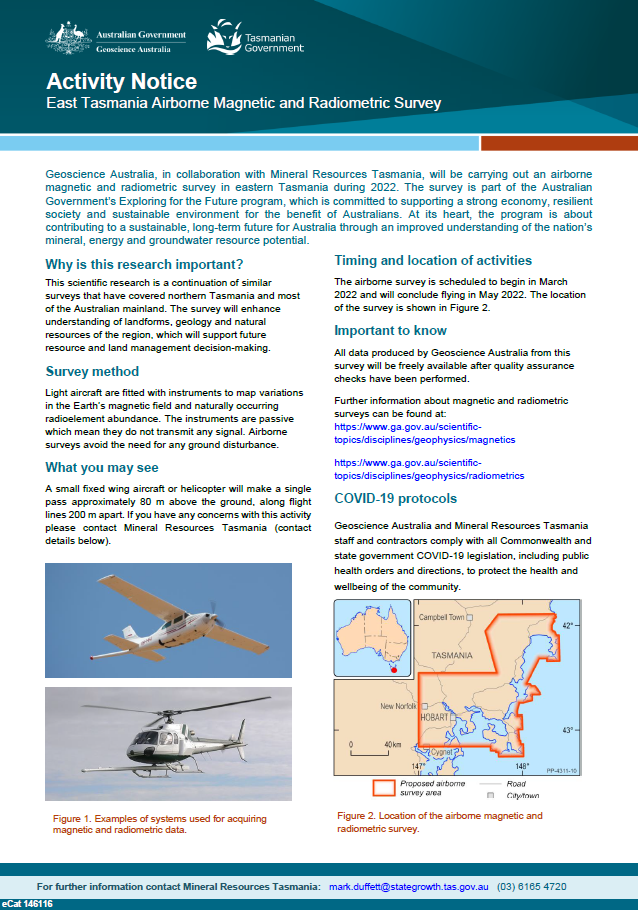
Geoscience Australia, in collaboration with Mineral Resources Tasmania, will be carrying out an airborne magnetic and radiometric survey in eastern Tasmania during 2022. The survey is part of the Australian Government’s Exploring for the Future program, which is committed to supporting a strong economy, resilient society and sustainable environment for the benefit of Australians. At its heart, the program is about contributing to a sustainable, long-term future for Australia through an improved understanding of the nation’s mineral, energy and groundwater resource potential. <p>
-
<p>Summary <p>Spring point locations compiled for the Nulla Basalt Province <p>A compilation of spring locations as identified through various methods, including existing Queensland Springs Database, topographic mapping, fieldwork visits, landholder citizen scientist mapping, and inspection for neighbouring similar features in Google Earth. This compilation has had locations adjusted through inspecting visible imagery and elevation data to identify the likely positions of springs at higher resolution.