OCEANOGRAPHY
Type of resources
Keywords
Publication year
Topics
-
The source code for the AusSeabed Survey Coordination Tool. Code is located at: https://github.com/ausseabed/survey-request-and-planning-tool The AusSeabed Survey Coordination tool (ASB SCT) is a tool designed by GA and FrontierSI in collaboration with the AusSeabed Steering Committee and broader community. Its intent is to provide a location for, and consistency in specification of bathymetric data acquisition for scientific research purposes. As of March 2022, the ASB SCT supports three key functions: 1) Survey Planning: the ASB SCT allows the community to publicise their plans to survey in the Austrlian Marine Estate. The tool ingests a spatial outline of the intended location as well as the target data types and focus for the survey. The tool also collects the contact details for the chief investigator and anticipated survey dates. Once published, the survey plan is visible on the upcoming surveys spatial layer on the AusSeabed portal. 2) Hydroscheme Industry Partnership Program Requests: the ASB SCT hosts the online form for submitting survey requests to the Australian Hydrographic Office (AHO) for consideration by the HydroScheme Industry Partnership Programme. 3) Areas of Interest submission: the ASB SCT ingests submissions that describe a users seabed mapping or biodiversity characterisation data needs and location. This information is useful in identifying regions of mutual interest and boosting collaborative multi-disciplinary surveys. Understanding regions with high levels of overlapping data needs can also help inform high-value survey activities and legacy data release priorities.
-
Background: Australia has a highly dynamic coastline of over 30,000 km, with over 85% of its population living within 50 km of the coast. This coastline is subject to a wide range of pressures, including extreme weather and climate, sea level rise and human development. Understanding how the coastline responds to these pressures is crucial to managing this region, from social, environmental and economic perspectives. What this product offers: Digital Earth Australia Coastlines is a continental dataset that includes annual shorelines and rates of coastal change along the entire Australian coastline from 1988 to the present. The product combines satellite data from Geoscience Australia's Digital Earth Australia program with tidal modelling to map the typical location of the coastline at mean sea level for each year. The product enables trends of coastal erosion and growth to be examined annually at both a local and continental scale, and for patterns of coastal change to be mapped historically and updated regularly as data continues to be acquired. This allows current rates of coastal change to be compared with that observed in previous years or decades. The ability to map shoreline positions for each year provides valuable insights into whether changes to our coastline are the result of particular events or actions, or a process of more gradual change over time. This information can enable scientists, managers and policy makers to assess impacts from the range of drivers impacting our coastlines and potentially assist planning and forecasting for future scenarios. Applications - Monitoring and mapping rates of coastal erosion along the Australian coastline - Prioritise and evaluate the impacts of local and regional coastal management based on historical coastline change - Modelling how coastlines respond to drivers of change, including extreme weather events, sea level rise or human development - Supporting geomorphological studies of how and why coastlines have changed across time
-
This GIS data layer shows the frequency of coastal upwelling along the south-eastern coast of Australia. The higher data values indicate areas of persistent and semi-persistent upwelling; while, the medium data values indicate areas of seasonal upwelling. The data was generated using 14 years of monthly MODIS SST data. Please refer to this publication: "Huang, Z., & Wang, X.H. (2019). Mapping the spatial and temporal variability of the upwelling systems of the Australian south-eastern coast using 14-year of MODIS data. Remote Sensing of Environment, 227, 90-109" (https://doi.org/10.1016/j.rse.2019.04.002) for details of the MODIS data and the upwelling mapping method.
-
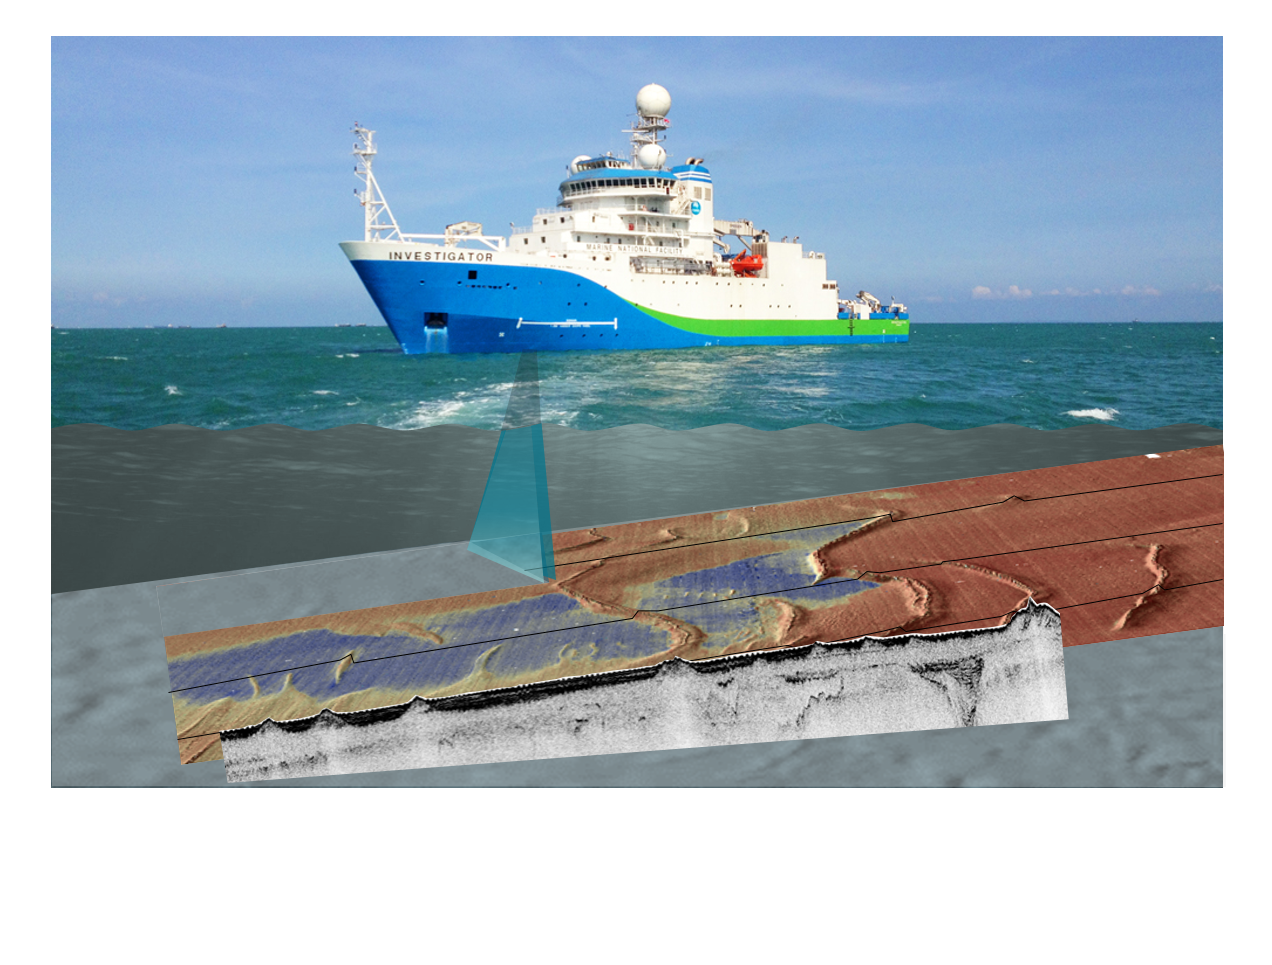
Have you ever wondered how we know the depth of the ocean? Sonar is the main technology used investigate the location of submarine canyons, seamounts, abyssal plains and if the seafloor is sand or rock. This activity builds understanding of sonar technique and applications through a) processing and plotting provided data to discover a seafloor feature or shipwreck, and b) bouncing balls on different surfaces and analysing rebound, relating this to ground hardness then extend understanding to ‘backscatter’ in bathymetry surveys. It is suitable for middle secondary students, but could be extended for senior students of Earth science, marine science/oceanography, and physics.
-
<div>This data submission was provided by the Offshore Energy Pty Ltd (also known as SOTS) to the Commonwealth under clause 8.3 of the Exploration Licence (D2024-46036). The data is Commercial-in-Confidence. </div><div><br></div><div>Under a Memorandum of Understanding dated 30 November 2022 between the Department of Climate Change, Energy, the Environment and Water (the department) and Geoscience Australia (GA) it was agreed that the management and sharing of offshore wind energy research and exploration data will be provided to the Commonwealth. This may be a one-off situation until new Legislation is developed. In the meantime, Exploration Licence conditions require the Offshore Energy Pty Limited (also known as SOTS) to submit data to the Commonwealth.</div><div><br></div><div>A SOTS Data Sharing Exchange of Letters was signed on March 2024 (D2024-46035) which outlined the terms under which data will be accepted and managed by GA on behalf of the Commonwealth.</div><div><br></div><div>The data was submitted to GA using the National Seabed Mapping (NSM) Data submission tool using a temporary Amazon s3 bucket. Data was received under three categories (Geophysical & Geotechnical; Meteorological &; Oceans, and Marine Ecosystems &; Ecological - totalling 29.5 TB (1.2 million files). A data listing can be found in the SOTS Exploration Licence data directory (D2024-22376). </div><div><br></div><div><br></div><div><br></div><div><strong>The department and GA have agreed that GA will:</strong></div><div><em>accept the data on behalf of the department; and</em></div><div><em>store the data in its data management platform and make it available to the department as agreed between us.</em></div><div><br></div><div><em>GA will, acting on behalf of the department, accept the data directly from SOTS.</em></div><div><br></div><div><strong>GA acknowledges that:</strong></div><div><em>the data is provided to the Commonwealth on the terms and conditions of the Exploration Licence;</em></div><div><em>GA accepts the data on those same terms, including in relation to confidentiality and intellectual property; and </em></div><div><em>this exchange of letters does not affect the ownership of intellectual property rights applicable to the data.</em></div><div><br></div><div><strong>GA will store the data securely in its information technology system, with internal access restricted on a need-to-know basis.</strong></div><div><br></div><div><strong>GA acknowledges that it holds and manages the data on behalf of the department for the purposes of the Archives Act 1983 (Cth) and it will consult with the department before destroying any data to ensure the department remains compliant with relevant information management legislation.</strong></div><div><br></div><div><strong>GA must not publish or disclose the data to a third party without SOTS’ prior written consent.</strong></div><div><em>If GA wishes to disclose the data to another Commonwealth agency, it must take all reasonable steps to protect confidentiality including by notifying the receiving agency that the data is confidential and requiring it to accept the data on the same terms as the Exploration Licence.</em></div><div><br></div><div><em>If GA wishes to use or disclose the data outside the terms of the Exploration Licence, it will enter into its own arrangements with SOTS.</em></div><div><em>GA will immediately inform the department if data is accessed, used, and/or disclosed except in accordance with the Exploration Licence and this letter.</em></div><div> </div><div>GA will immediately inform the department if data is accessed, used and/or disclosed except in accordance with the Exploration Licence and the Data Sharing Exchange of Letters.</div><div><br></div><div>Following discussions between NSM staff, the Director of Data Services and the Manager, Data Governance and Catalogue it was agreed that the Geoscience Australia Information Archive (GAIA) would be the best solution to fulfill the requirements of the Data Sharing Exchange of Letters and to ensure the enduring value of the data to the Commonwealth.</div><div><br></div><div>GA Roles and Responsibilities have been outlined in the Lineage and in D2024-46051.</div>
-
The map and underlying digital dataset provide national and regional-scale context for a wider variety of applications, including offshore industries, area-based environmental management, scientific research and public education. Australia’s Seabed Map is based on the revised AusBathyTopo 250m (Australia) 2023 grid (Beaman, 2023), the most comprehensive, continental-scale compilation of bathymetry data in the Australian region. The map extends across a vast area from 92°E to 172° E and 8°S to 60° S. This includes areas adjacent to the Australian continent and Tasmania, and surrounding Macquarie Island and the Australian Territories of Norfolk Island, Christmas Island, and Cocos (Keeling) Islands. Australia's marine jurisdiction offshore from the territory of Heard and McDonald Islands and the Australian Antarctic Territory are not included. The new map provides a complete three-dimensional picture of the seafloor and is a significant improvement since it was last revised in 2009. In particular, the map incorporates new innovations such as the use of earth observation data (satellite based) produced by Digital Earth Australia to improve coastline definition and present a seamless transition between land and sea. The data is compiled from 1582 individual surveys using multibeam echosounders, single-beam echosounders, LiDAR, or 3D seismic first returns, as well as higher-resolution regional compilations, and other source data including Electronic Navigation Charts and satellite derived bathymetry. The new map represents decades of data collection, analysis, investment and collaboration from Australia’s seabed mapping community. The 250 m resolution is only supported where direct bathymetric observations are sufficiently dense (e.g. where swath bathymetry data or digitised chart data exist). In many regions, this 250 m grid size is far in excess of the optimal grid size for some of the input data used. The AusBathyTopo250m grid and higher-resolution regional datasets are available on the AusSeabed Marine Data Portal as the AusBathyTopo Series. This map is not suitable for use as an aid to navigation, or to replace any products produced by the Australian Hydrographic Office. Medium: Digital PDF download.
-
At far-field coasts the largest tsunami waves often occur many hours after arrival, and hazardous waves may persist for more than a day. To simulate tsunamis at far-field coasts it is common to combine high-resolution nonlinear shallow water models (covering sites of interest) with low-resolution reduced-physics global-scale models (to efficiently simulate propagation). The global propagation models often ignore friction and are mathematically energy conservative, so in theory the modelled tsunami will persist indefinitely. In contrast, real tsunamis exhibit slow dissipation at the global-scale with an energy e-folding time of approximately one day. How strongly do these global-scale approximations affect nearshore tsunamis simulated at far-field coasts? To investigate this issue we compare modelled and observed tsunamis at sixteen nearshore tide-gauges in Australia, which were generated by the following earthquakes: Mw 9.5 Chile 1960; Mw 9.2 Sumatra 2004; Mw 8.8 Chile 2010; Mw 9.1 Tohoku 2011; and Mw 8.3 Chile 2015. Each historic tsunami is represented with multiple earthquake source models from the literature, to prevent bias in any single source from dominating the results. The tsunami is simulated for 60 hours with a nested global-to-local model. On the nearshore grids we solve the nonlinear shallow water equations with Manning-friction, while on the global grid we test three reduced-physics propagation models which combine the linear shallow water equations with alternative treatments of friction: 1) frictionless; 2) nonlinear Manning-friction; and 3) constant linear-friction. In comparison with data, the frictionless global model works well for simulating nearshore tsunami maxima for ~ 8 hours after tsunami arrival, and Manning-friction gives similar predictions in this period. Constant linear-friction is found to under-predict the size of early arriving waves. As the simulation duration is increased from 36 to 60 hours, the frictionless global model increasingly over-estimates the observed tsunami maxima; whereas both models with global-scale friction perform relatively well. The constant linear-friction model can be improved using delayed linear-friction, where propagation is simulated with an initial frictionless period (12 hours herein). This prevents the systematic underestimation of early nearshore wave heights. While nonlinear Manning-friction offers comparably good performance, a practical advantage of the linear-friction models in this study is that their solutions can be computed, to high accuracy, with a simple transformation of frictionless solutions. This offers a pragmatic approach to improving unit-source based global tsunami simulations at late times.