AusAEM
Type of resources
Keywords
Publication year
Topics
-
<p>The AusAEM Year 1 NT/QLD Airborne Electromagnetic Survey covers the Newcastle Waters and Alice Springs 1:1 Million map sheets in the Northern Territory and the Normanton and Cloncurry 1:1 Million map sheets in Queensland. CGG Aviation (Australia) Pty. Ltd. flew the 67,700-line kilometre survey between 2017 and 2018 using the TEMPEST® airborne electromagnetic system. Flown at 20-kilometre line spacing, data were acquired and processed under contract to Geoscience Australia. <p>This data package supersedes and replaces two earlier releases: June 11, 2018, and December 2018 (eCatID 120948) with revised calibrations and processing. Along with the regionally spaced (20 km) flight lines, it now includes 1,500 line kilometres of infill flying that was funded by private exploration companies and not previously released in view of time-bounded confidentiality agreements. The survey was commissioned by Geoscience Australia as part of the Exploring for the Future (EFTF) program. The EFTF program is led by Geoscience Australia (GA), in collaboration with the Geological Surveys of the Northern Territory, Queensland, South Australia and Western Australia, and is investigating the potential mineral, energy and groundwater resources in northern Australia and South Australia. The EFTF is a four-year $100.5 million investment by the Australian Government in driving the next generation of resource discoveries in northern Australia, boosting economic development across this region. This Data Release (Phase 1) Package contains the final survey deliverables produced by the contractor CGG, including: <p>a) The operations and processing report. <p>b) Final processed electromagnetic, magnetic and elevation point located line data. <p>c) Final processed electromagnetic, magnetic and elevation grids. <p>d) Conductivity estimates generated by the EM Flow® conductivity depth-imaging algorithm. <p>e) Graphical multi-plots of line data and EM Flow® conductivity sections. <p>f) Graphical stacked EM Flow® conductivity sections. <p>g) ESRI shape-files containing the flight line locations. <p>An updated release package (Phase 2), which contains results from our in-house inversion of the EM data (from this Phase 1 release), which includes the regional and infill areas are downloadable from the link provided in the Downloads tab.
-
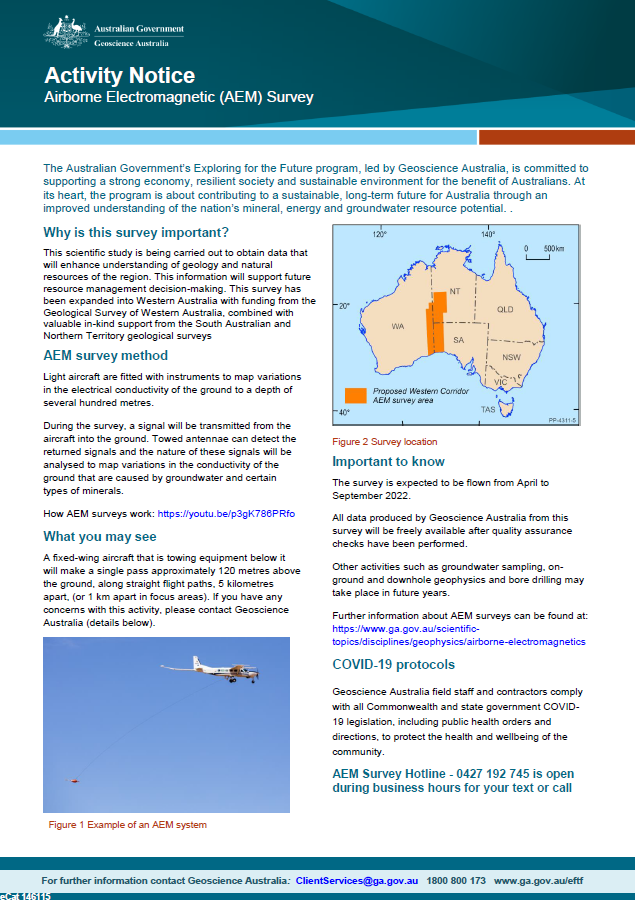
Geoscience Australia, in collaboration with state governments, will be carrying out airborne electromagnetic (AEM) surveys in western South Australia, southern NT and eastern WA during 2022. This scientific research is being carried out to obtain data that will enhance understanding of geology and natural resources of the region. This information will support future resource management decision-making. This survey has been expanded into Western Australia with funding from the Geological Survey of Western Australia, combined with valuable in-kind support from the South Australian and Northern Territory geological surveys. <p>
-
This animation shows how Airborne Electromagnetic Surveys Work, when conducted by a rotary wing (helicopter) aircraft. It is part of a series of Field Activity Technique Engagement Animations. The target audience are the communities that are impacted by our data acquisition activities. There is no sound or voice over. The 2D animation includes a simplified view of what AEM equipment looks like, what the equipment measures and how the survey works.
-
The AusAEM1 survey is the world’s largest airborne electromagnetic survey flown to date, extending across an area exceeding 1.1 million km2 over Queensland and the Northern Territory. Approximately 60 000 line kilometres of data were acquired at a nominal line spacing of 20 km. Using this dataset, we interpreted the depth to chronostratigraphic surfaces, assembled stratigraphic relationship information, and delineated structural and electrically conductive features. Our results improved understanding of upper-crustal geology, led to 3D mapping of palaeovalleys, prompted further investigation of electrical conductors and their relationship to structural features and mineralisation, and helped us continuously connect correlative outcropping units separated by up to hundreds of kilometres. Our interpretation is designed to improve targeting and outcomes for mineral, energy and groundwater exploration, and contributes to our understanding of the chronostratigraphic, structural and upper-crustal evolution of northern Australia. More than 150 000 regional depth measurements, each attributed with detailed geological information, are an important step towards a national geological framework, and offer a regional context for more detailed, smaller-scale AEM surveys. <b>Citation:</b> Wong, S.C.T., Roach, I.C., Nicoll, M.G., English, P.M., Bonnardot, M.-A., Brodie, R.C., Rollet, N. and Ley-Cooper, A.Y., 2020. Interpretation of the AusAEM1: insights from the world’s largest airborne electromagnetic survey. In: Czarnota, K., Roach, I., Abbott, S., Haynes, M., Kositcin, N., Ray, A. and Slatter, E. (eds.) Exploring for the Future: Extended Abstracts, Geoscience Australia, Canberra, 1–4.
-
For the AusAEM Year 1 survey an inertial measurement unit (IMU) was installed for the first time on the TEMPEST receiver bird to measure its orientation and to augment GPS derived positioning of the receiver. This has given us the opportunity to develop better quality control and calibration procedures, which would otherwise not be possible. Theoretical modelling of the primary field on high altitude zero-lines, using the full position/orientation information, revealed discrepancies between observed and modelled data. It alerted us to time-lag parallaxes between EM and bird position/orientation data, some spurious IMU data on many pre-flight zero-lines, and a coordinate system sign convention inconsistency. The modelling also revealed systematic differences that we could attribute to the calibration of the receiver pitch and EM data scaling. We developed an inversion algorithm to solve for a receiver pitch offset and an EM scaling calibration parameter, for each zero-line, which minimised the systematic discrepancies. It eventuated that the calibration parameters fell into five distinct populations explicable by significant equipment changes. This gave us the confidence to use the medians of these populations as parameters to calibrate the data. The work shows the value of the new receiver bird orientation data and the importance of accurate IMU calibration after any modification. It shows the practical utility of quantitative modelling in the quality control workflow. It also demonstrates how modelling and inversion procedure can be used to successfully diagnose calibration issues in fixed-wing AEM data. Presented at the 2019 Australasian Exploration Geoscience Conference
-
Airborne electromagnetic data generated by the AusAEM Survey are shown to map mineral deposit host rocks and regional geological features within the AusAEM Survey area. We have developed new functionality in Geoscience Australia’s sample-by-sample layered earth inversion algorithm, allowing inversion of the magnitude of the combined vector sum of the X- and Z-components of TEMPEST AEM data. This functionality improves the clarity of inverted interpretation products by reducing the degree of along-line incoherency inherent to stitched 1D inversions. The new inversion approach improves the interpretability of sub-horizontal conductors, allowing better mapping of geological features under cover. Examples of geological mapping by the AusAEM survey highlight the utility of wide line spacing, regional AEM surveying to improve geological, mineral systems and groundwater resource understanding in the regions flanking outcropping mineral deposit host rocks in northern Australia. Presented at the 2019 Australasian Exploration Geoscience Conference
-
The AusAEM Year 1 NT/QLD Airborne Electromagnetic Survey covers the Newcastle Waters and Alice Springs 1:1 Million map sheets in the Northern Territory, plus the Normanton and Cloncurry 1:1 Million map sheets in Queensland. The survey was flown at 20 kilometre line spacing and entails approximately 60,000 line kilometres of data in total. The data were acquired in 2017 and 2018 by CGG Aviation (Australia) Pty. Ltd. (CGG), under contract to Geoscience Australia, using the TEMPEST® airborne electromagnetic system. The data were also processed by CGG. This Tranche 1 data release package only contains approximately the first one third (19,500 line kilometres) of the survey data that were acquired between August 4 and October 7, 2017. The AusAEM Year 1 NT/QLD survey also included over 1,500 line kilometres of infill flying, that was funded by private exploration companies, in certain infill blocks within the survey area. These infill blocks and data are not part of this data release due to confidentiality agreements. The survey was commissioned by Geoscience Australia as part of the Exploring for the Future (EFTF) program. The EFTF program is led by Geoscience Australia (GA), in collaboration with the Geological Surveys of the Northern Territory, Queensland, South Australia and Western Australia, and is investigating the potential mineral, energy and groundwater resources in northern Australia and South Australia. The EFTF is a four-year $100.5 million investment by the Australian Government in driving the next generation of resource discoveries in northern Australia, boosting economic development across this region. This Data Release Package (Tranche 1, Phase 1) contains the final survey deliverables produced by the contractor CGG, including: (a) the operations and processing report, (b) final processed electromagnetic, magnetic and elevation point located line data, (c) final processed electromagnetic, magnetic and elevation grids, (d) conductivity estimates generated by the EM Flow® conductivity depth imaging algorithm, (e) graphical multiplots of line data and EM Flow® conductivity sections, (f) graphical stacked EM Flow® conductivity sections, (h) ESRI shapefiles containing the flight line locations. Future data release packages will contain data flown after October 7 2017 (Tranche 2, etc.) and further derived products (Phase 2, etc.).
-
Building on newly acquired airborne electromagnetic and seismic reflection data during the Exploring for the Future (EFTF) program, Geoscience Australia (GA) generated a cover model across the Northern Territory and Queensland, in the Tennant Creek – Mount Isa (TISA) area (Figure 1; between 13.5 and 24.5⁰ S of latitude and 131.5 and 145⁰ E of longitude) (Bonnardot et al., 2020). The cover model provides depth estimates to chronostratigraphic layers, including: Base Cenozoic, Base Mesozoic, Base Paleozoic and Base Neoproterozoic. The depth estimates are based on the interpretation, compilation and integration of borehole, solid geology, reflection seismic, and airborne electromagnetic data, as well as depth to magnetic source estimates. These depth estimates in metres below the surface (relative to the Australian Height Datum) are consistently stored as points in the Estimates of Geophysical and Geological Surfaces (EGGS) database (Matthews et al., 2020). The data points compiled in this data package were extracted from the EGGS database. Preferred depth estimates were selected to ensure regional data consistency and aid the gridding. Two sets of cover depth surfaces (Bonnardot et al., 2020) were generated using different approaches to map megasequence boundaries associated with the Era unconformities: 1) Standard interpolation using a minimum-curvature gridding algorithm that provides minimum misfit where data points exist, and 2) Machine learning approach (Uncover-ML, Wilford et al., 2020) that allows to learn about relationships between datasets and therefore can provide better depth estimates in areas of sparse data points distribution and assess uncertainties. This data package includes the depth estimates data points compiled and used for gridding each surface, for the Base Cenozoic, Base Mesozoic, Base Paleozoic and Base Neoproterozoic (Figure 1). To provide indicative trends between the depth data points, regional interpolated depth surface grids are also provided for the Base Cenozoic, Base Mesozoic, Base Paleozoic and Base Neoproterozoic. The grids were generated with a standard interpolation algorithm, i.e. minimum-curvature interpolation method. Refined gridding method will be necessary to take into account uncertainties between the various datasets and variable distances between the points. These surfaces provide a framework to assess the depth and possible spatial extent of resources, including basin-hosted mineral resources, basement-hosted mineral resources, hydrocarbons and groundwater, as well as an input to economic models of the viability of potential resource development.
-
The Exploring for the Future (EFTF) program is unmatched for the scale of geoscience data acquisition across northern Australia, covering 37 648 individual land parcels and 2.9 million km2. The scale of works has raised many new challenges for Geoscience Australia (GA) through the diverse range of field activities, and the numerous stakeholders from different social and cultural backgrounds, across multiple jurisdictions. Success of the program depended on the development and maintenance of a social licence to operate. This was broadly achieved for fieldwork activities through early engagement with stakeholders, including free, prior and informed consent. Here, we present two case studies of stakeholder engagement for facilitation of data collection: one focuses on broadscale, low-impact field activities associated with the AusAEM survey; and the other on Indigenous-focused engagement related to the Barkly Seismic Survey. Because of the complexity of project planning and managing such a large number of stakeholders, GA’s project governance team was expanded; it now includes a dedicated Land and Marine Access team and a commitment to adopt world-leading engagement practices. One practice is to consider impacts and benefits for all stakeholders—not just landholders—of field activities and data acquisition programs. This includes a plan for how the data are delivered back to the communities and stakeholders, and how information exchanges can be built into projects. The aim is for stakeholders to hold GA in the highest regard and understand the benefits to the Australian people, and ultimately their own communities, from the geoscientific data that GA produces. <b>Citation:</b> Mouthaan, R., Buchanan, S. and Sweeney, M, 2020. Land access and Indigenous engagement for Australian geoscience. In: Czarnota, K., Roach, I., Abbott, S., Haynes, M., Kositcin, N., Ray, A. and Slatter, E. (eds.) Exploring for the Future: Extended Abstracts, Geoscience Australia, Canberra, 1–4.
-
<div><strong>Yathong, Forbes, Dubbo, and Coonabarabran Airborne Electromagnetic Survey Blocks.</strong></div><div><br></div><div>Geoscience Australia (GA), in collaboration with the Geological Survey of New South Wales (GNSW), conducted an airborne electromagnetic (AEM) survey from April to June 2023. The survey spanned from the north-eastern end of the Yathong-Ivanhoe Trough and extended across the Forbes, Dubbo, and Coonabarabran regions of New South Wales. A total of 15, 090-line kilometres of new AEM and magnetic geophysical data were acquired. This survey was entirely funded by GSNSW and GA managed acquisition, quality control, processing, modelling, and inversion of the AEM data.</div><div><br></div><div>The survey was flown by Xcalibur Aviation (Australia) Pty Ltd using a 6.25 Hz HELITEM® AEM system. The survey blocks were flown at 2500-metre nominal line spacings, with variations down to 100 metres in the Coonabarabran block. It was flown following East-West line directions. Xcalibur also processed the acquired data. This data package includes the acquisition and processing report, the final processed AEM data, and the results of the contractor's conductivity-depth estimates. The data package also contains the results and derived products from a 1D inversion by Geoscience Australia with its own inversion software.</div><div><br></div><div>The survey will be incorporated and become part of the national AusAEM airborne electromagnetic acquisition program, which aims to provide geophysical information to support investigations of the regional geology and groundwater.</div><div><br></div><div><strong>The data release package contains:</strong></div><div><br></div><div>1. A data release package <strong>summary PDF document</strong></div><div>2. The <strong>survey logistics and processing report</strong> and HELITEM® system specification files</div><div>3. <strong>Final processed point located line data</strong> in ASEG-GDF2 format for the five areas</div><div> -final processed dB/dt electromagnetic, magnetic and elevation data</div><div> -final processed B field electromagnetic, magnetic and elevation data</div><div><strong> <em>Conductivity estimates generated by Xcalibur’s inversion </em></strong></div><div> -point located conductivity-depth line data output from the inversion in ASEG-GDF2 format</div><div> -graphical (PDF) multiplot conductivity stacks and section profiles for each flight line</div><div> -graphical (PNG) conductivity sections for each line</div><div> -grids generated from the Xcalibur’s inversion in ER Mapper® format (layer conductivities slices, DTM, X & Z component for each of the 25 channels, time constants, TMI)</div><div>4.<strong> ESRI shape and KML</strong> (Google Earth) files for the flight lines and boundary</div><div>5<strong>. Conductivity estimates generated by Geoscience Australia's inversion </strong></div><div> -point located line data output from the inversion in ASEG-GDF2 format</div><div> -graphical (pdf) multiplot conductivity sections for each line</div><div> -georeferenced (PNG) conductivity sections (suitable for pseudo-3D display in a 2D GIS)</div><div> -GoCAD™ S-Grid 3D objects (suitable for various 3D packages)</div><div> -Curtain image conductivity sections in log & liner colour stretch (suitable 3D display in GA’s EarthSci)</div><div><br></div><div><strong>Directory structure</strong></div><div>├── <strong>01_Report</strong></div><div>├── <strong>02_XCalibur_delivered</strong></div><div>│ ├── * survey_block_Name</div><div>│ ├── cdi</div><div>│ │ ├── sections</div><div>│ │ └── stacks</div><div>│ ├── grids</div><div>│ │ ├── cnd</div><div>│ │ ├── dtm</div><div>│ │ ├── emxbf</div><div>│ │ ├── emxdb</div><div>│ │ ├── emxff</div><div>│ │ ├── emxzbf</div><div>│ │ ├── emzdb</div><div>│ │ ├── time_constant</div><div>│ │ └── tmi</div><div>│ ├── located_data</div><div>│ ├── maps</div><div>│ └── waveform</div><div>│ </div><div>├── <strong>03_Shape&kml</strong></div><div>└── <strong>04_GA_Layer_Earth_inversion</strong></div><div> ├── * survey_block_Name</div><div> ├── GA_georef_sections</div><div> │ ├── linear-stretch</div><div> │ └── log-stretch</div><div> ├── GA_Inverted_conductivity_models</div><div> ├── GA_multiplots</div><div> └── GA_sgrids</div><div> </div> <b>Final Processed point located line data is available on request from clientservices@ga.gov.au - Quote eCat# 149118</b>