Mapping
Type of resources
Keywords
Publication year
Service types
Topics
-
<div>The Proterozoic alkaline and related igneous rocks of Australia is a surface geology compilation of alkaline and related igneous rocks of Proterozoic age in Australia. This dataset is one of five datasets, with compilations for Archean, Paleozoic, Mesozoic and Cenozoic alkaline and related igneous rocks already released.</div><div><br></div><div>Geological units are represented as polygon and point geometries and, are attributed with information that includes, but is not limited to, stratigraphic nomenclature and hierarchy, age, lithology, composition, proportion of alkaline rocks, body morphology, unit expression, emplacement type, presence of mantle xenoliths and diamonds, and primary data source. Source data for the geological unit polygons provided in Data Quality LINEAGE. Geological units are grouped into informal geographic “alkaline provinces”, which are represented as polygon geometries, and attributed with information similar to that provided for the geological units.</div>
-
Delineation of Australia's domestic and international maritime limits and boundaries. These boundaries include a variety of jurisdictional, economic, regulatory and legal boundaries. <b>Value:</b> Used by national governments, businesses, organisations in determining boundaries for zones governed/managed by different regulatory structures/requirements. <b>Scope:</b> A national dataset at resolution relevant for presentation of regional spatial data such as digital maps or regional decision making.
-
This OGC Web Map Service (WMS) contains seabed morphology and geomorphology information for a subset area of Zeehan Marine Park (South-east Marine Parks Network) and is intended for use by marine park managers, regulators and other stakeholders. This web service uses the data product published in McNeil et al. (2023); eCat Record 148620.
-
<div>The 1:250,000 AUSTopo Map Series Index underpins the new 1:250,000 AUSTopo Australian Digital Topographic Map Series (published from 2023). The index drives the online 1:250,000 topographic index dashboard and accompanying web service. Within this index, each of the 516 map sheets that comprehensively cover Australia is presented as an individual tile. The dataset contains value-add attributes, including map title, tile number, the latitude and longitude of the maps sheets, and year/s published. The index also features direct download links to the maps. </div><div><br></div><div>This index exists alongside the previous 1:250,000 map series index, which served as the framework for map editions published between 1995 to 2012. </div><div><br></div><div>Available in ESRI Shapefile and GDB.</div>
-
This OGC Web Feature Service (WFS) contains geospatial seabed morphology and geomorphology information for Flinders Reefs within the Coral Sea Marine Park and are intended for use by marine park managers, regulators, the general public and other stakeholders. This web service uses the data product published in McNeil et al. (2023); eCat Record 147998.
-
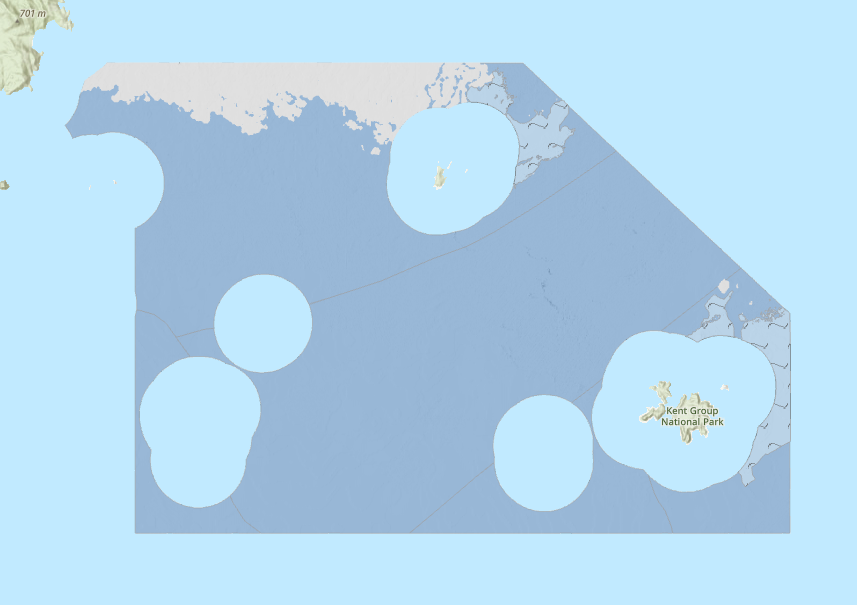
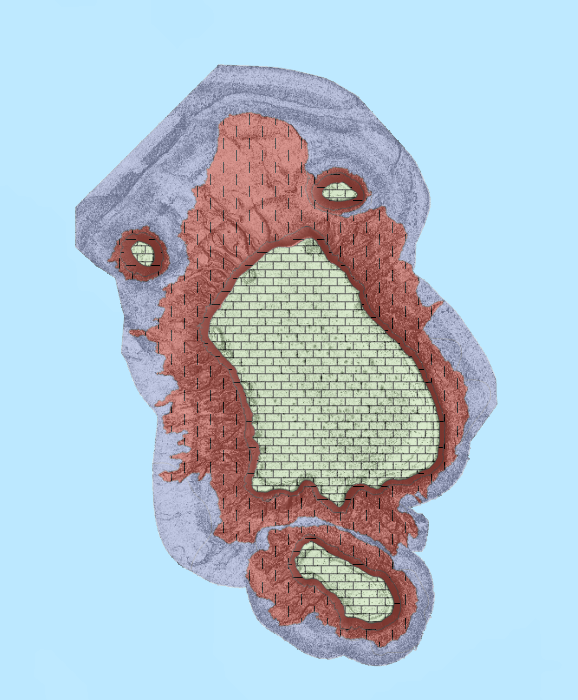
This ESRI map (web) service contains geospatial seabed morphology and geomorphology information for the Beagle Marine Park (South-east Marine Parks Network) and is intended for use by marine park managers, regulators and other stakeholders. This web service uses the data product published in Nanson et al. (2023); eCat Record 147976.
-
Coastal environments are intrinsically dynamic and respond to a wide array of natural and anthropogenic drivers across a broad range of time steps. In addition, coastal environments are under increasing pressure from land use intensification and climate change. The development of the Australian Geoscience Data Cube has delivered an unprecedented capability to support environmental change monitoring applications through rapid processing and analysis of standardised Earth Observation (EO) time-series data in a High Performance Computing environment. Standardised long-term EO data records provide the capacity to monitor coastal changes processes and understand current changes from a historical perspective. The ability to visualise environmental changes in a spatio-temporal context provides the opportunity to assess whether the change phenomena are rapid / gradual onset, and/or episodic / cyclical in nature. Understanding the spatio-temporal nature of the changes also enables the attribution of observed changes to the potential causes. Hovmöller diagrams, typically used to plot meteorological data, can be applied for visualising large datasets in a meaningful way. In this study, we apply Hovmöller plots to examine coastal change processes and estuarine dynamics, based on a time-series of Landsat based surface reflectance data over a 27-year period (1987-2014), within the Australian Geoscience Data Cube. The Hovmöller plot in Figure 1 highlights the timing of a sea wall installation and associated land reclamation processes near Fremantle, Western Australia (see PDF attachment).Three coastal change processes are illustrated in this study: 1. The opening, closing and migration of the mouth of the Glenelg River in Victoria; the Hovmöller plots show that the river mouth moves on an episodic basis and remains closed for periods of time. 2. The installation of a sea wall and subsequent land reclamation near Fremantle in Western Australia; the results illustrate rapid anthropogenic change in the coastal zone and highlight the timing of the sea wall installation and land reclamation processes. 3. The migration of coastal dune fields north of Perth in Western Australia; the results show slow coastal change processes through the gradual northward migration of the dune field over multi-decadal time scales. The availability of standardised long-term Landsat data, in conjunction with new data becoming available from the Copernicus Sentinel-2 missions, point to the need for cross calibrated multi-sensor data, to enrich the global long-term EO record, in support of the detection and characterisation of coastal change phenomena. Presented at the 2016 Living Planet Symposium (LPS16) Prague, Czech Republic
-
This OGC Web Map Service (WMS) contains geospatial seabed morphology and geomorphology information for the Beagle Marine Park (South-east Marine Parks Network) and is intended for use by marine park managers, regulators and other stakeholders. This web service uses the data product published in Nanson et al. (2023); eCat Record 147976.
-
This ESRI map (web) service contains geospatial seabed morphology and geomorphology information for Flinders Reefs within the Coral Sea Marine Park and are intended for use by marine park managers, regulators, the general public and other stakeholders. This web service uses the data product published in McNeil et al. (2023); eCat Record 147998.
-
Mapped and projected extents of geology and geologic features in Australia, including: surface geology, regolith geology, solid geology, chronostratigraphic surfaces, and province boundaries. The database includes igneous, sedimentary and structural characteristics, age limits, parent and constituent units, relations to surrounding provinces, and mineral and petroleum resources. based on field observations interpretations of geophysics and borehole data. <b>Value:</b> Data used for understanding surface and near surface geology. The data can be used for a variety of purposes, including resource exploration, land use management, and environmental assessment. <b>Scope:</b> Australia and Australian Antarctic Territory