EDUCATION
Type of resources
Keywords
Publication year
Topics
-
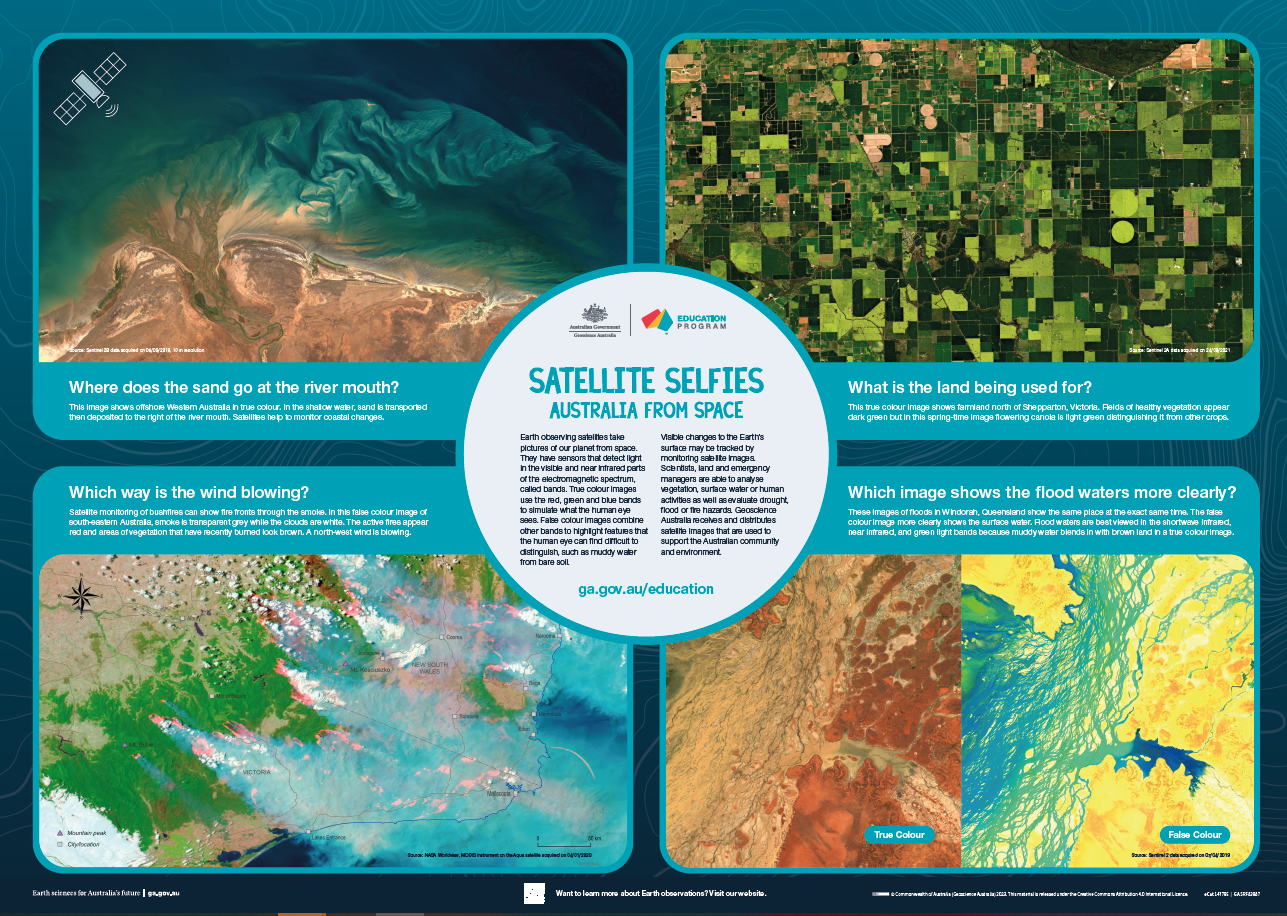
<div>The A1 poster incorporates 4 images of Australia taken from space by Earth observing satellites. The accompanying text briefly introduces sensors and the bands within the electromagnetic spectrum. The images include examples of both true and false colour and the diverse range of applications of satellite images such as tracking visible changes to the Earth’s surface like crop growth, bushfires, coastal changes and floods. Scientists, land and emergency managers use satellite images to analyse vegetation, surface water or human activities as well as evaluate natural hazards.</div>
-
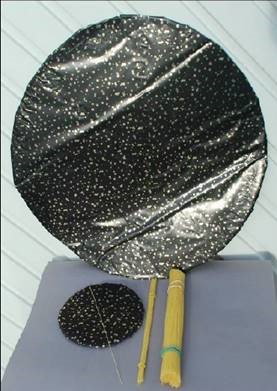
Background information for teachers/parents and an activity about earthquake magnitude using spaghetti pasta.
-
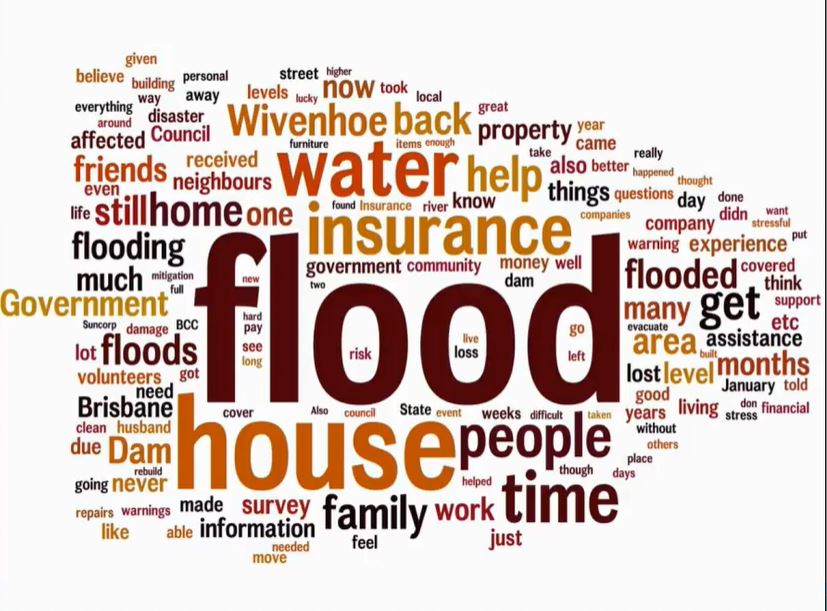
Article for the Australian Journal of Emergency Management (AJEM), October 2019 ed. Lead authors were Department of Fire and Emergency Services (WA), co-authored by GA. This article includes discussion of how GA's data and products - specifically felt report data and trial ShakeMap and Did-You-Feel-It products were used by DFES in the days following the Magnitude 6.6 earthquake which occurred 210km offshore from Broome, WA, on 14 July 2019. The data and products contributed to DFES' understanding of what local communities experienced, how they responded, and the extent of building and infrastructure damage caused by the earthquake. This understanding will contribute to DFES' community awareness programs focusing on safety and preparedness, and to DFES' own response and recovery planning.
-
Promotional Video designed to highlight the appeal of the Geological TimeWalk and attract visitors to Geoscience Australia, featuring GA Chief Scientist Dr. Steve Hill.
-
The Land Air Marine Access team have developed a Best Practice Standards approach to land, air and marine access and stakeholder engagement to protect Geoscience Australia's social licence and maximise the benefits of our science outcomes.
-
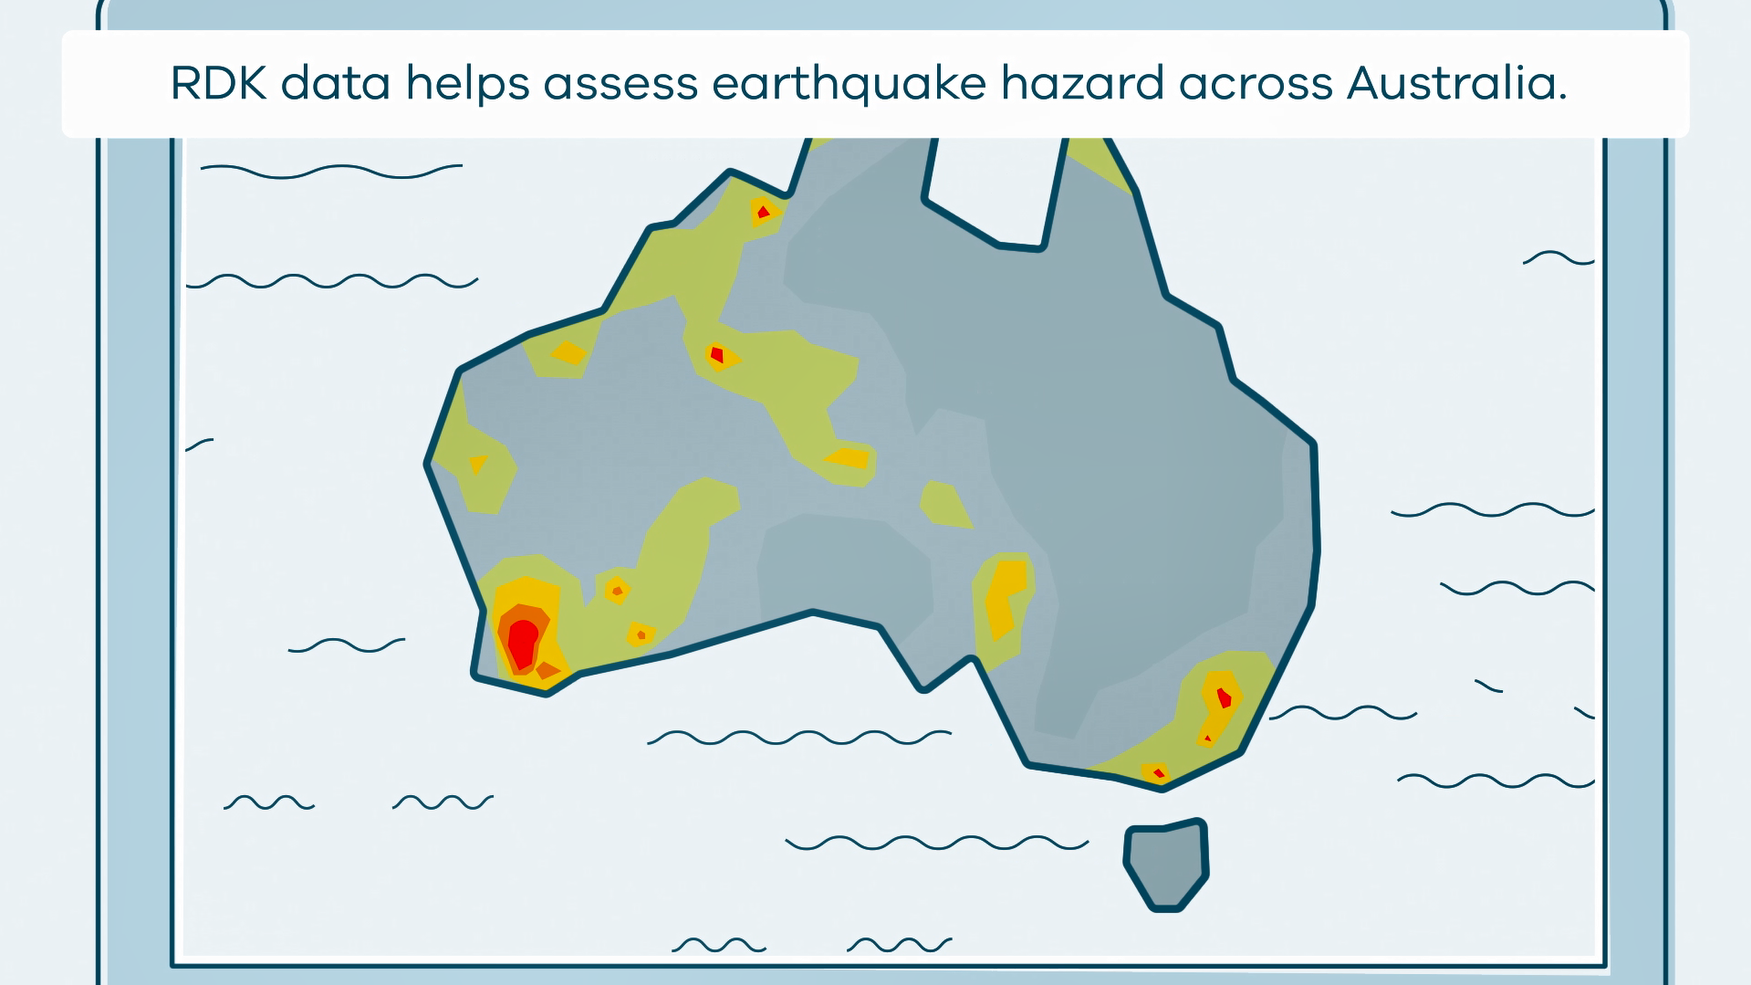
This animation shows what happens when rapid deployment kits (RDKs) are deployed after an earthquake. It is part of a series of Field Activity Technique Engagement Animations. The target audience are the communities that are impacted by GA's data acquisition activities. There is no sound or voice over. The 2D animation includes a simplified view of what rapid deployment kits (RDKs) look like, what is measured, and how scientists use the data.
-
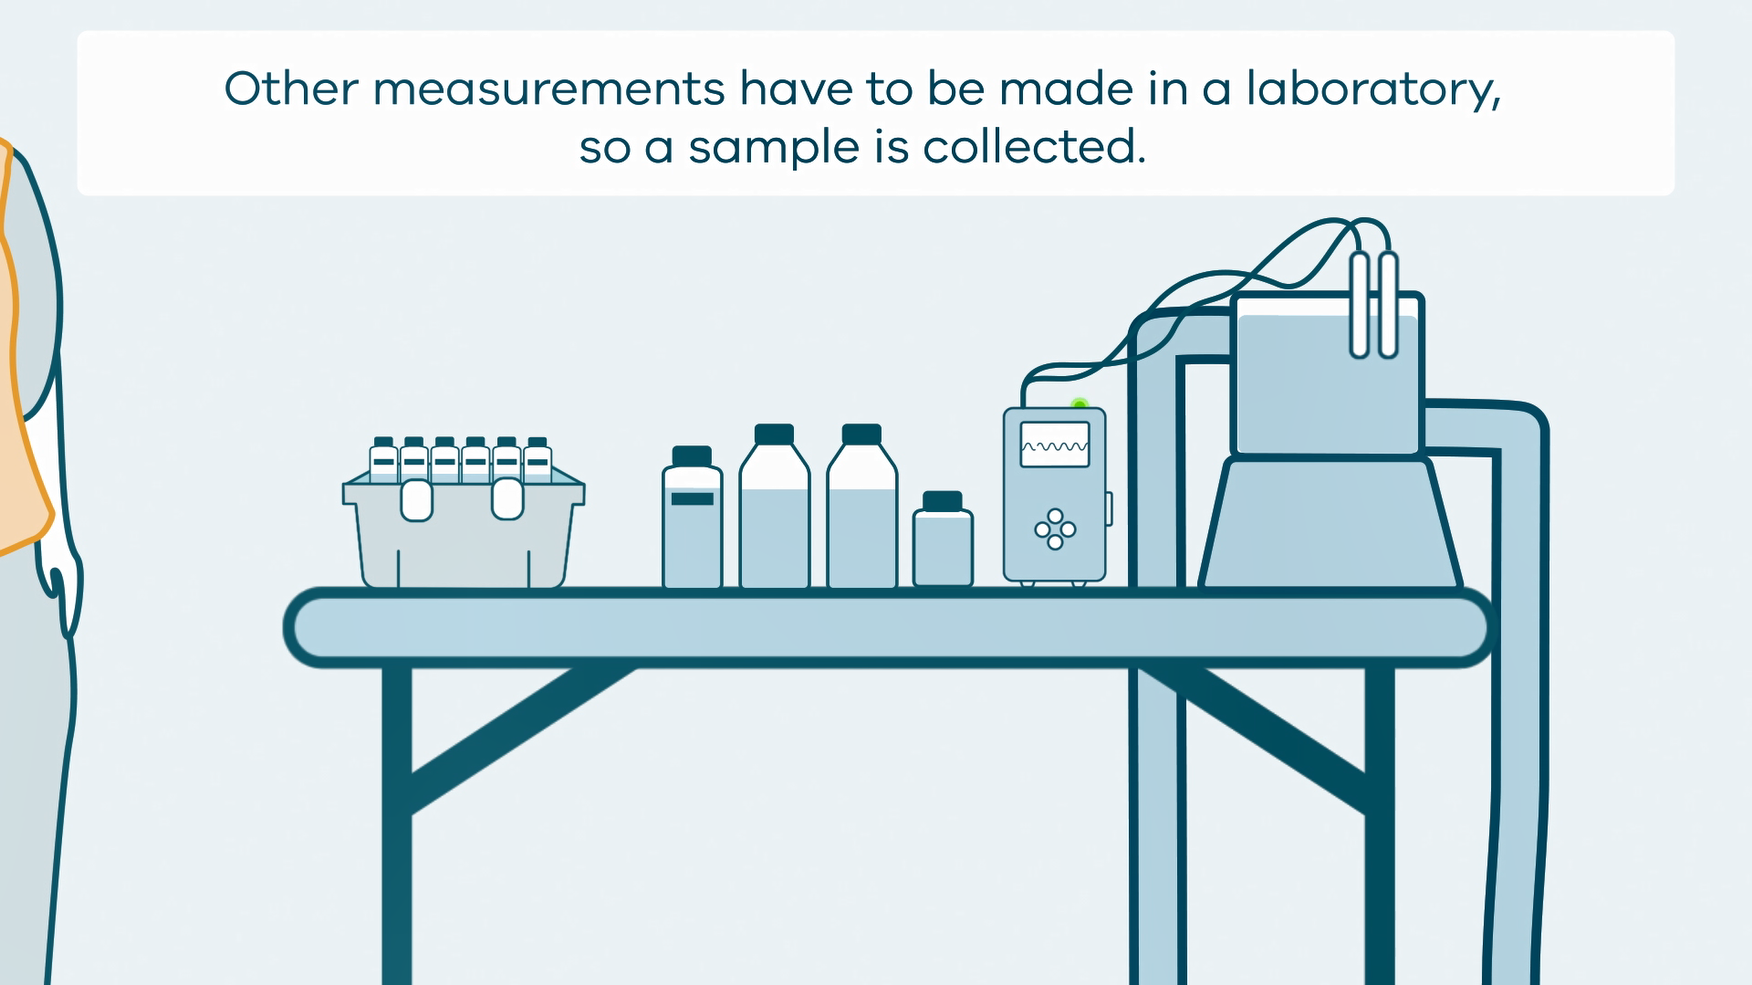
This animation shows how groundwater sampling is conducted. It is part of a series of Field Activity Technique Engagement Animations. The target audience are the communities that are impacted by GA's data acquisition activities. There is no sound or voice over. The 2D animation includes a simplified view of what groundwater sampling equipment looks like, what the equipment measures and how scientists use the data.
-
Many scientific talks by Geoscience Australia staff are published on YouTube. These documents provide summaries (‘crib sheets’) of the presentations along with easy access links to each part of the video. They are intended to help teachers of Year 11/12 classes learning about natural hazards
-
How do some of the rocks in Minecraft form and behave in real life? This short video discusses bedrock, obsidian and redstone using real rock samples and references to the game.
-
This video is a flythrough around the coast of Australia shows the major topographic features of the seafloor around the continent. Starting in the south west the viewer can see the continental shelf and slope of the southern coast followed by the seamount chains and the Great Barrier Reef to the east. Continuing around the north then west coast the eastern end of the Java Trench is shown before returning to Perth and pulling out to show the whole continent. The bathymetry is shown at x12 exaggeration and uses a modern colour ramp. Video length 2min 30 sec.

