HSI
Type of resources
Keywords
Publication year
Topics
-
This gravity anomaly image has been generated from the Bouguer Gravity Anomaly Grid of Australia 2016. The Bouguer grid has been image enhanced and displayed as a hue-saturation-intensity (HSI) image with sun shading from the northeast. The product has been derived from observations stored in the Australian National Gravity Database (ANGD) as at February 2016 together with the 2013 New South Wales Riverina gravity survey. Out of the almost 1.8 million records in the ANGD approximately 1.4 million stations were used to generate this image. The image shows spherical cap Bouguer anomalies over onshore continental Australia. The data used in this image has been acquired by the Commonwealth, State and Territory Governments, the mining and exploration industry, universities and research organisations from the 1940's to the present day. The spherical cap Bouguer anomalies in this image are the combination of Bullard A and B corrections to the Free Air anomaly values using a density of 2670 kg/m^3.
-
This image is derived from gravity observations stored in the Australian National Gravity Database (ANGD) as at February 2016 as well as data from the 2013 New South Wales Riverina gravity survey. Out of the approximately 1.8 million gravity observations 1,371,998 gravity stations in the ANGD together with 19,558 stations from the Riverina survey were used to generate this image. The image shows isostatic residual gravity anomalies over onshore continental Australia. The data used in this image has been acquired by the Commonwealth, State and Territory Governments, the mining and exploration industry, universities and research organisations from the 1940's to the present day. The isostatic corrections were based on the assumption that topographic loads are compensated at depth by crustal roots following the Airy-Heiskanen isostatic principle. A crustal density of 2670 kg/m3 was used for the isostatic correction, with an assumed density contrast between the crust and mantle of 400 kg/m3. An initial average depth to Moho at sea level of 37 km was used in the calculation. The isostatic corrections were then applied to the Complete Bouguer Gravity Anomaly Grid of Onshore Australia 2016 to produce the isostatic residual gravity anomaly grid. The Isostatic Residual Gravity Anomaly Grid of Onshore Australia 2016 has been image enhanced and displayed as a hue-saturation-intensity (HSI) image with sun shading from the northeast to create this product.
-
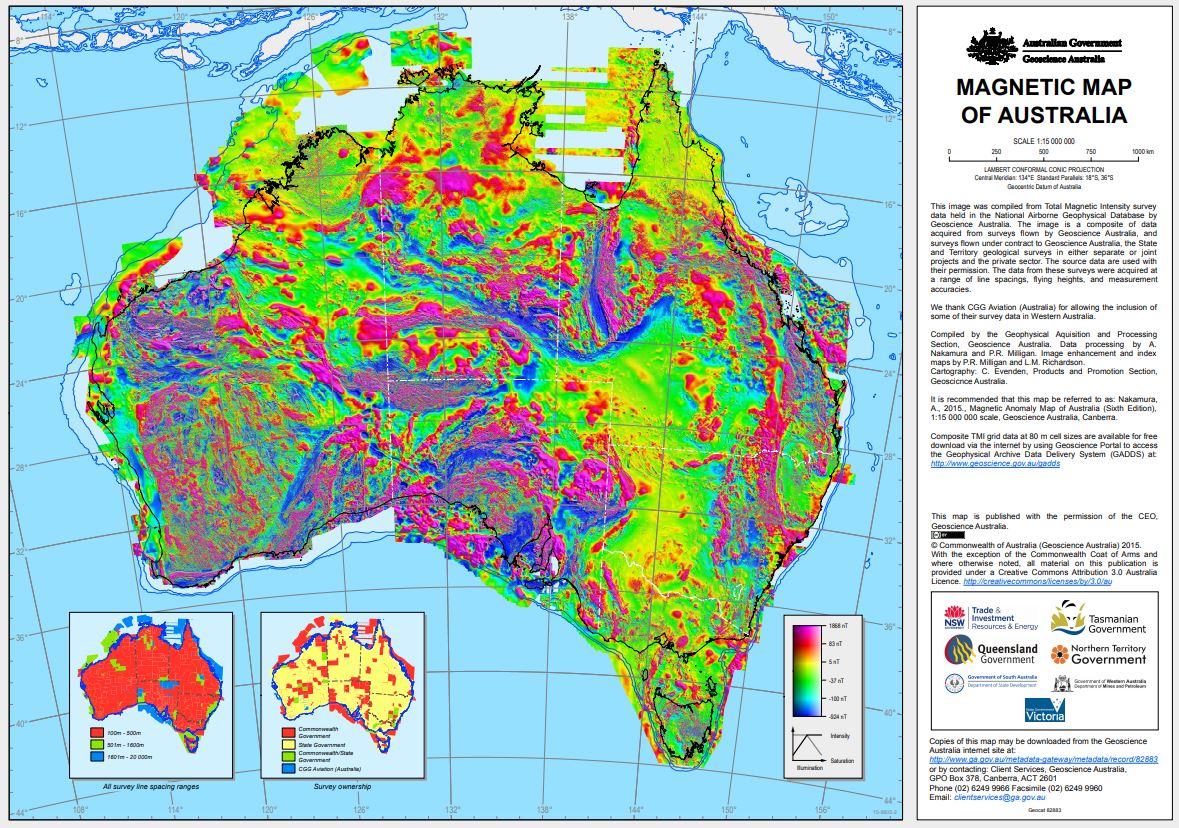
Total Magnetic Intensity colour composite image 2015 The image was created from the Total Magnetic Intensity Grid 2015 - sixth edition. This image has a cell size of ~3 seconds of arc (approximately 80 m) and has been image enhanced for optimal display in Hue-Saturation-Intensity (HSI). This image only includes airborne-derived TMI data for onshore and near-offshore continental areas. Since the fifth edition was released in 2010 data from 41 new surveys have been added to the database, acquired mainly by the State and Territory Geological Surveys. It is estimated that 31 500 000 line-kilometres of survey data were acquired to produce the grid data, 4 500 000 line-kilometres more than for the previous edition.
-
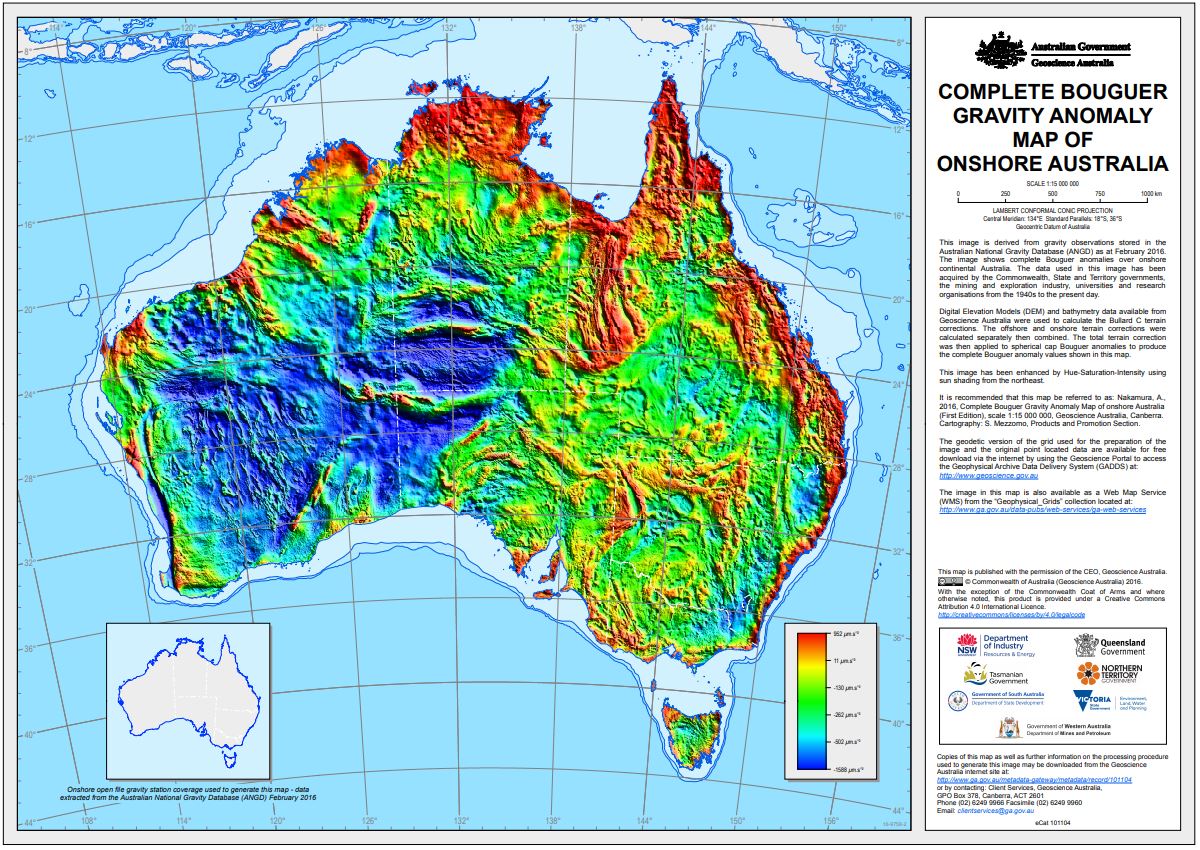
This gravity anomaly image has been derived from observations stored in the Australian National Gravity Database (ANGD) as at February 2016 as well as data from the 2013 New South Wales Riverina gravity survey. Out of the approximately 1.8 million gravity observations 1,371,998 gravity stations in the ANGD together with 19,558 stations from the Riverina survey were used to generate this image. The image shows complete Bouguer anomalies over onshore continental Australia. The data used in this image has been acquired by the Commonwealth, State and Territory Governments, the mining and exploration industry, universities and research organisations from the 1940's to the present day. Terrain corrections to gravity were calculated using both offshore bathymetry and onshore topography data. These terrain corrections were applied to the spherical cap Bouguer anomalies used in the Bouguer Gravity Anomaly Grid of Onshore Australia 2016 to produce the complete Bouguer anomalies shown in this image. The Complete Bouguer Gravity Anomaly Grid of Onshore Australia 2016 has been image enhanced and displayed as a hue-saturation-intensity (HSI) image with sun shading from the northeast to create this product.