Poster/Image
Type of resources
Keywords
Publication year
Scale
Topics
-
Displayed at Questacon July 21-22
-
Geoscience Australia produces optimized statistical predictions of seabed sediment distribution for the Australian continental Exclusive Economic Zone. These products are broadly relevant to the work of government policy and research organizations and the offshore oil and gas industry. To better promote the features and relevance of these products, we need to produce 1-3 posters. These will provide graphic examples of the spatial predictions, comparisons between previous and recent versions of this dataset to demonstrate the increase in accuracy and resolution achieved, and provide information about how to access the data. These posters will be used to promote this work at relevant external workshops and conferences. We also need to produce some simple A4 size pamphlets/flyers based on the posters, which can be easily carried and distributed to various audiences. This would increase the awareness of GA's products in marine environmental geosciences, boost the usage of the products by both internal and external clients and promote GA's profile in generating quality geoscience information.
-
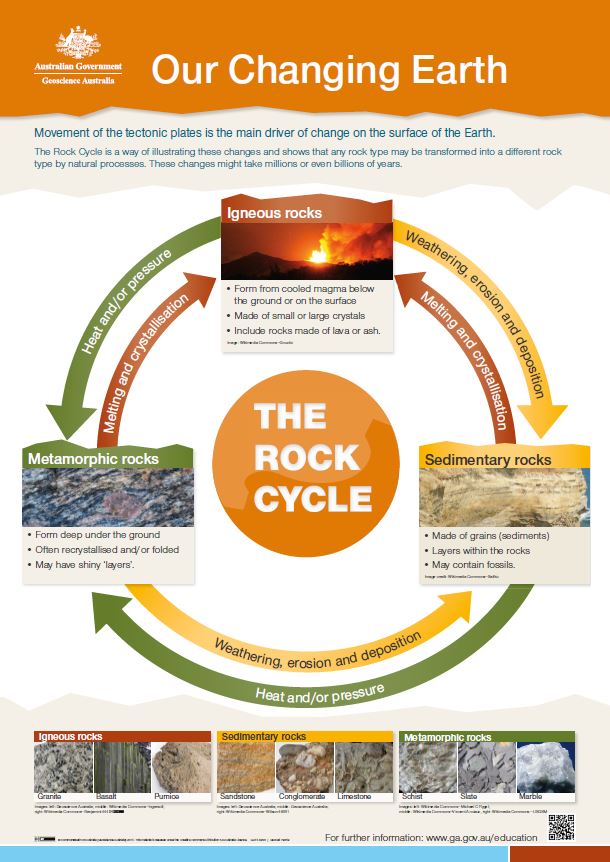
This is an education product for primary and lower secondary school use. The poster illustrates that all rock types can be changed to different types of rock by natural processes. There is simple information on the features of igneous, sedimentary and metamorphic rocks together with images of selected rock samples. The poster supports concepts about the earth being ever-changing.
-
Poster linked to accepted WABS abstract: GeoCat #74808 West Australian Basins Symposium (WABS), Perth, 18-21 August 2013
-
Poster to be presented to the 2013 Fire Weather Workshop
-
The Canning Basin in northwestern Australia covers an area of over 506,000 sq. km, of which 430,000 sq. km are onshore. The maximum sediment thickness is over 15,000 m, concentrated in two north-west trending depocentres: the Fitzroy Trough - Gregory Sub-basin complex and the Willara Sub-basin - Kidson Sub-basin complex. Onshore sediments range in age from the Early Ordovician to Early Cretaceous while those in the offshore portion of the basin are mostly Triassic to Neogene. Though it is largely covered by onshore petroleum tenements, much of the basin is underexplored. Conventional hydrocarbons have been produced from Devonian carbonates (Blina) and Carboniferous sandstones (Boundary, Lloyd, Point Torment, Sundown, West Kora and West Terrace), with many shows in Ordovician to Permian rocks. The recent Ungani-1 well flowed oil from the Laurel Formation, while in 1967 Yulleroo-1 flowed gas from the same unit. The basin's source rocks have recently been attracting exploration attention for their unconventional hydrocarbon resources. Prospective units include the Ordovician Goldwyer and Bongabinni formations, and the Mississippian Laurel Formation. A new International Geological Timescale (Gradstein et al. 2012) has resulted in changes to the age and duration of most chronological stages. This has implications for the interpreted ages and durations of Canning Basin sedimentary units, with potential ramifications for petroleum modelling. This poster presents an updated biozonation and stratigraphy chart for the Canning Basin, reflecting the 2012 timescale. This provides a baseline for an assessment of the unconventional hydrocarbon potential of the basin, which will be conducted by Geoscience Australia.
-
The Cooper Basin is a late Carboniferous-Middle Triassic intracratonic basin in northeastern South Australia and southwestern Queensland. The basin is one of Australia's premier onshore hydrocarbon producing provinces and, by providing domestic gas for the East Coast Gas Market, is nationally significant. This study reviews the distribution, quality and maturity of source rocks across the Cooper Basin and forms part of Geoscience Australia's source rock program. All publicly-available total organic carbon (TOC) content and Rock-Eval pyrolysis data for the Cooper Basin were compiled into a single database, quality checked and compiled by well and formation to highlight the multiple viable source rock units throughout the Permian. The Toolachee and Patchawarra formations represent the principal source rocks in the basin. These comprise coals and carbonaceous shales deposited in fluvial deltaic and peat swamp environments and show good to very good oil and gas source potential. Additional source intervals include the gas prone lacustrine Roseneath and Murteree shales, as well as coals and carbonaceous shales of the Daralingie and Epsilon formations. Permian source rock distribution was investigated using lithofacies mapping combined with geochemistry data. Lithofacies maps published for South Australia were integrated with electrofacies data from Queensland to produce new, internally consistent, net source thickness maps for key intervals, including coals and carbonaceous shales of the Toolachee and Patchawarra formations, and the Roseneath and Murteree shales. Pyrolysis data that indicate the presence of an in-situ source rock with remaining hydrocarbon generation potential (i.e. TOC > 2% and S1+S2 > 3 mg hydrocarbons/g rock) were mapped by formation, demonstrating the broad extent of Permian source rocks across the basin. Toolachee and Patchawarra source rocks are present in most major depocentres, including the Windorah Trough and Ullenbury Depression in the northern part of the basin, where maximum coal thicknesses still reach more than 10 m. Source rocks within the Roseneath and Murteree shale are generally restricted to the southern Cooper Basin.
-
Poster presented at JAXA ALOS-2 1st PI workshop in Tsukuba, Japan, 19-20 September 2013
-
This study documents the natural gas compositions of accumulations on the Exmouth Plateau and adjacent Rankin Platform in the Carnarvon Basin, a proven super-giant gas province on the North West Shelf of offshore Western Australia. The Exmouth Plateau contains Australia's largest undeveloped gas resources. The primary reservoirs are the Middle Late Triassic Mungaroo Formation (Chrysaor, Dionysus, Geryon, Maenad, Orthrus and Urania discoveries), the Late Jurassic sands of the Dingo Claystone at Geryon and Io/Jansz, and the Early Cretaceous Barrow Group at Scarborough. The gas accumulations at Geryon, Io/Jansz, Maenad, Orthrus and Urania are dry, with condensate to gas ratios (CGRs) of about 3 bbls/MMscf, although they contain low proportions of wet gases (average 100*(C1/ C1-C5) = 93.4 %). These gases typically have low concentrations of carbon dioxide (CO2 <2.6 %). The gas at Scarborough is extremely dry (100*(C1/C1-C5) = 99.9 %), with low concentrations of carbon dioxide (CO2 = 0.4 %). The d13C isotopic value of methane is -42.3, signifying the bacterial alteration of a thermogenic gas (Boreham et al., 2001). Wet gas is produced from the Mungaroo Formation on the northern Rankin Platform, with some of the wettest gases occurring at Goodwyn (CGR = 143 bbls/MMscf) and Echo/Yodel (CGR = 235 bbls/MMscf). The Mungaroo reservoired gas is drier (CGR ~12 bbls/MMscf) in Gorgon, located on the southern Rankin Platform. The Gorgon and neighbouring West Tryal Rocks, Chrysaor and Dionysus accumulations have elevated carbon dioxide (CO2) contents with the concentration and isotopic enrichment of CO2 increasing from the shallower (CO2 = 8 %; d13C CO2 = -5) to the deeper (CO2 = 23 %; d13C CO2 = -3) reservoirs. The isotopically enriched CO2 may originate from either a magmatic source or from the thermal decomposition of limestones within the deeply buried Permian, Triassic and Early Jurassic sediments. Mixing of inorganic and organic CO2 could explain the concentration isotopic trend observed in these accumulations. Gas: gas correlations based on the carbon (d13C) and hydrogen (dD) isotopic compositions of individual hydrocarbons from methane to n-pentane (C1-C5) are shown in Figure 1. The Geryon 1, Jansz 1, Maenad 1A, Orthrus 1 and Urania 1 gases have similarly shaped d13C isotopic profiles that show little differentiation between ethane, propane and butane (Figure 1a). Such a flat isotopic profile is typical of a terrigenous gas source (James, 1990) and may indicate either different sources for the wet gases and methane or facies changes within the same source rock. The most likely primary source of the Exmouth Plateau hydrocarbon gases is the regressive fluvial deltaic Triassic Mungaroo Formation. The isotopic profiles of the Gorgon 3 and North Gorgon 6 (southern Rankin Platform) and Chrysaor 1 gases display an almost linear d13C n-alkane profile (Figure 1c) and imply a different source province from that of the other Exmouth Plateau gases, most probably from Triassic Jurassic sediments in the Barrow Sub-basin, as well as within the Rankin Platform. The carbon and hydrogen isotopic profiles of the Dionysus gas are most similar to the other Exmouth Plateau gases (Figure 1b, d); however, its high concentration of isotopically enriched CO2 is most similar to the gases from the Gorgon area, suggesting the mixing of multiple sources of gas from different depocentres into this accumulation.
-
Geoscience Australia is currently assessing selected Australian sedimentary basins for their unconventional hydrocarbon resource potential, in collaboration with the Northern Territory and state governments. A study of the southern Georgina Basin is in progress, involving the compilation of a cross-border dataset of all accessible open file seismic, well, geological and geochemical data that will be publicly released in mid-2014. Major geochemical resampling of old wells has generated new information on source rock characteristics, kerogen kinetics, and gas and oil isotope geochemistry in the Georgina Basin. Preliminary 3D geology and 1D petroleum systems models have also been generated. Several cores from the Georgina Basin have been HyLogged by the geological surveys of Northern Territory, Queensland and New South Wales, using HyLogging facilities funded by AuScope Pty Ltd and CSIRO as part of the National Collaborative Research Infrastructure Strategy (NCRIS) and AuScope National Virtual Core Library (NVCL) Project. Geoscience Australia currently has a project underway to reprocess the raw HyLogging data using a common set of mineral scalars, to create an internally-consistent, basin-wide dataset. An initial composite HyLogging data package was publicly released in March 2014, including reprocessed data for 14 wells in the southern Georgina Basin, information about the processing methods used, and metadata. A second stage of the project will involve interpretation of the reprocessed data from these wells, to further examine the relationships between the spectroscopic and mineralogical properties measured by the HyLogger, and core total organic carbon (TOC), XRD, XRF and ICPMS compositional data, well log data, and biostratigraphic data. Initial work has indicated interesting trends, such as the apparent relationship between gamma intensity, core SWIR albedo (mean shortwave infrared reflectance) and quartz content. Peaks in gamma intensity broadly align with troughs in albedo, suggesting that the reduced albedo is a result of increased TOC content. However, in others cores (or even the same core), peaks in gamma intensity also appear to correlate with potassium-rich phases such as white micas and other clay minerals, thus the gamma correlation does not appear straightforward. Other preliminary observations indicate that using HyLogging data provides (i) the opportunity to review the existing formation picks in the basin from a mineralogical perspective, (ii) new information on variations in calcite/dolomite proportions in the carbonate sequences, (iii) the ability to map apatite distribution, and (iv) mineralogical evidence of sedimentary cyclicity. It is thus hoped that integrated interpretation of the HyLogging data and other data types will enable clearer delineation of the lower Arthur Creek Formation (and the 'Hot Shale' within) in the Georgina Basin, and therefore assist in constraining target intervals for future unconventional hydrocarbon resource assessments.