Sedimentology
Type of resources
Keywords
Publication year
Service types
Topics
-
Here we present the surficial geology map for the Vestfold Hills, East Antarctica. On the coast of Prydz Bay, the region is one of the largest ice-free areas in Antarctica. Surficial geology mapping at 1:2000 was undertaken with field observations in the 2018/19 and 2019/20 summer seasons as well as aerial photography and satellite imagery interpretation. Units are based on the Geological Survey of Canada Surficial Data Model Version 2.4.0 (Deblonde et al 2019).
-
This web service contains sediment and geochemistry data for the Oceanic Shoals Commonwealth Marine Reserve (CMR) in the Timor Sea collected by Geoscience Australia during September and October 2012, on RV Solander (survey GA0339/SOL5650).
-
This Daly Basin dataset contains descriptive attribute information for the areas bounded by the relevant spatial groundwater feature in the associated Hydrogeology Index map. Descriptive topics are grouped into the following themes: Location and administration; Demographics; Physical geography; Surface water; Geology; Hydrogeology; Groundwater; Groundwater management and use; Environment; Land use and industry types; and Scientific stimulus. The Daly Basin is a geological formation consisting of Cambrian to Ordovician carbonate and siliciclastic rocks, formed approximately 541 million to 470 million years ago. The basin stretches about 170 km in length and 30 km in width, shaped as a northwest elongated synform with gentle dips of less than 1 degree, likely due to prolonged sedimentary deposition in the shallow seas of the Centralian Superbasin, possibly along basin-scale faults. The primary groundwater reservoir within the Daly Basin is found in the Cambrian Daly River Group. This group comprises three units: the Tindall Limestone, Jinduckin Formation, and Oolloo Dolostone. The Tindall Limestone, which lies at the base, consists of grey, mottled limestone with some maroon-green siltstone or dark grey mudstone. The transition from the Tindall Limestone to the overlying Jinduckin Formation is marked by a shift from limestone to more siliciclastic rocks, indicating a change from open-shelf marine to peri-tidal environments. The Jinduckin Formation, situated above the Tindall Limestone, is composed of maroon-green dolomitic-siliciclastic siltstone with interbeds of dolomitic sandstone-siltstone, as well as dolostone and dolomitic quartz sandstone lenses. It gradually transitions into the carbonate-rich Oolloo Dolostone, with the highest finely laminated dolomitic sandstone-siltstone interbeds at the top of the Jinduckin Formation. The Oolloo Dolostone, the uppermost unit of the Daly River Group, comprises two members: the well-bedded lower Briggs Member, consisting of fine- to medium-grained crystalline dolostone and dolomitic quartz sandstone, and the massive upper King Member. Overlying the Daly River Group is the Ordovician Florina Formation, consisting of three carbonate intervals separated by two fine-grained, glauconite-bearing quartz sandstone units. The Florina Formation and the Daly River Group are covered unconformably by Cretaceous claystone and sandstone of the Carpentaria Basin, which extends over a significant portion of the Daly Basin.
-
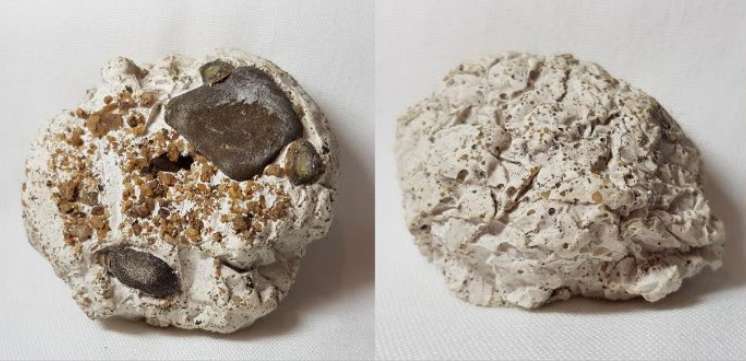
Would you like to make your own rock? In this set of activities you can simulate the natural processes that form sedimentary rocks in just a few hours, instead of taking millions and millions of years. All the activities can be undertaken using readily available materials. Supervision recommended.
-
Preamble -- The 'National Geochemical Survey of Australia: The Geochemical Atlas of Australia' was published in July 2011 along with a digital copy of the NGSA geochemical dataset (doi: 10.11636/Record.2011.020). The NGSA project is described here: www.ga.gov.au/ngsa. The present dataset contains additional geochemical data obtained on NGSA samples: the Plutonium Isotopes Dataset. Abstract -- Seventy three fine-fraction (<75 um) Top Outlet Sediment (TOS, 0 – 10 cm depth) NGSA samples from Queensland were analysed for the plutonium (Pu) isotopes 238Pu and 239+240Pu (unresolved 239Pu and 240Pu) to determine: (1) if Pu is detectable in the Australian environment; and (2) what the levels and ranges of Pu retention in selected Queensland catchment soils are. Radiochemical analyses were performed by alpha spectrometry at the radioanalytical laboratories of Radiation and Nuclear Sciences, Department of Health, Queensland, and at the Australian Radiation Protection and Nuclear Safety Agency (ARPANSA), Victoria. The method yielded a 239+240Pu trace-level detection limit of 0.04 mBq/g (equivalent to 10.4 fg/kg or 0.0056 net counts per minute) with a relative standard deviation (RSD) of 15.1%. The average tracer recovery was 69% (RSD 25%) over a 3-day count. Total analytical uncertainty ranged from 19% to 90% at close to detection limits. Field duplicate repeatability for 239+240Pu activity concentration ranged from 18% to 45%, which in part at least reflects the inherent heterogeneity of soil/sediments containing refractory particles exhibiting variation in Pu activity concentrations. Analytical duplicate repeatability for 239+240Pu activity concentration ranged from 10% to 23%, with the mean activity concentration and error of the replicates reported with propagation of errors. The results show a wide range of 239+240Pu activity concentration in the fine TOS NGSA samples across Queensland (N = 73): 239+240Pu: Min = <0.04 mBq/g; Med ± MAD (median absolute deviation) = 0.09 ± 0.07 mBq/g; Mean ± SD = 0.29 ± 0.72 mBq/g; 95th percentile = 1.53 mBq/g; Max = 4.88 mBq/g. In comparison the world average background is estimated at 0.2 mBq/g. Analytical results for 39% of samples were below detection. Six samples with 239+240Pu > 0.18 mBq/g (70th percentile) were also analysed for 238Pu by the same alpha spectrometry method. Results ranged from 0.04 to 0.1 mBq/g (N = 6). The complete dataset is available to download as a comma separated values (CSV) file from Geoscience Australia's website (https://pid.geoscience.gov.au/dataset/ga/144101).
-
This Carpentaria Basin dataset contains descriptive attribute information for the areas bounded by the relevant spatial groundwater feature in the associated Hydrogeology Index map. Descriptive topics are grouped into the following themes: Location and administration; Demographics; Physical geography; Surface water; Geology; Hydrogeology; Groundwater; Groundwater management and use; Environment; Land use and industry types; and Scientific stimulus. The Carpentaria Basin is a vast intra-cratonic sedimentary basin situated on and offshore in north-eastern Australia, covering around 550,000 square kilometres across Queensland and the Northern Territory. It comprises predominantly sandstone-rich rock units deposited during sea level highs from the Late Jurassic to Mid Cretaceous. The basin overlies a heterogeneous Proterozoic basement and is separated from contemporaneous sedimentary structures by basement highs and inliers. Four main depocentres within the larger Carpentaria Basin form four major sub-basins: the Western Gulf Sub-basin, Staaten Sub-basin, Weipa Sub-basin, and Boomara Sub-basin. While the basin is extensive and continuous in Queensland, it becomes more heterogeneous and discontinuous in the Northern Territory. Remnants of the basin's stratigraphy, referred to as the Dunmarra Basin, are found along the Northern Territory coast and inland. The depositional history commenced during the Jurassic with down warping near Cape York Peninsula, resulting in the Helby beds and Albany Pass beds' concurrent deposition. The basin experienced marine transgressions during the Cretaceous, with the Gilbert River Formation widespread and the Wallumbilla Formation occurring during sea level highs. The Carpentaria Basin's strata are relatively undeformed and unmetamorphosed. The Northern Territory sequence displays slightly different stratigraphy, limited to the height of the Aptian marine transgression above the Georgina Basin. The Walker River Formation and Yirrkala Formation represent key units in this area, outcropping as tablelands and mesas largely unaffected by tectonism.
-
This South Nicholson Basin dataset contains descriptive attribute information for the areas bounded by the relevant spatial groundwater feature in the associated Hydrogeology Index map. Descriptive topics are grouped into the following themes: Location and administration; Demographics; Physical geography; Surface water; Geology; Hydrogeology; Groundwater; Groundwater management and use; Environment; Land use and industry types; and Scientific stimulus. This South Nicholson Basin dataset contains descriptive attribute information for the areas bounded by the relevant spatial groundwater feature in the associated Hydrogeology Index map. Descriptive topics are grouped into the following themes: Location and administration; Demographics; Physical geography; Surface water; Geology; Hydrogeology; Groundwater; Groundwater management and use; Environment; Land use and industry types; and Scientific stimulus. The South Nicholson Basin is a Mesoproterozoic sedimentary basin spanning Queensland and the Northern Territory and is bordered by neighbouring provinces and basins. The basin unconformably overlies the Lawn Hill Platform of the Mount Isa Province to the east, is bound by the Warramunga and Davenport provinces to the south-west, the Murphy Province to the north and the McArthur Basin to the north-west. It extends southwards under younger cover sequences. Rock units in the basin are correlated with the Roper Group in the McArthur Basin, forming the 'Roper Superbasin.' The underlying Mount Isa Province contains potential shale gas resources. The basin mainly consists of sandstone- and siltstone-bearing units, including the South Nicholson Group, with a prevailing east to east-northeast structural grain. Mild deformation includes shallowly plunging fold axes and numerous faults along a north-west to south-east shortening direction. Major geological events affecting the South Nicholson Basin region include the formation of the Murphy Province's metamorphic and igneous rocks around 1850 million years ago (Ma). The Mount Isa Province experienced deposition in the Leichhardt Superbasin (1800 to 1750 Ma) and Calvert Superbasin (1725 to 1690 Ma). The Isa Superbasin, with extensional growth faulting in the Carrara Sub-basin (~1640 Ma), deposited sediments from approximately 1670 to 1590 Ma. Subsequently, the South Nicholson Group was deposited around 1500 to 1430 Ma, followed by the Georgina Basin's sedimentation. The basin shows potential for sandstone-type uranium, base metals, iron ore, and petroleum resources, while unconventional shale and tight gas resources remain largely unexplored. The Constance Sandstone holds promise as a petroleum reservoir, and the Mullera Formation and Crow Formation serve as potential seals.
-
This Western Australian Fractured Rock Province dataset contains descriptive attribute information for the areas bounded by the relevant spatial groundwater feature in the associated Hydrogeology Index map. Descriptive topics are grouped into the following themes: Location and administration; Demographics; Physical geography; Surface water; Geology; Hydrogeology; Groundwater; Groundwater management and use; Environment; Land use and industry types; and Scientific stimulus. The geological evolution of Australia can be summarised as a west-to-east growth pattern, resulting from the assembly and disintegration of several supercontinents since the Archean era. The oldest rocks are found in Western Australia, specifically within the Western Australia fractured rock province, which consists of two crustal elements: the West Australian Element and the Pinjarra Element. The Yilgarn and Pilbara cratons in the West Australian Element host the oldest rocks in continental Australia, featuring high-grade gneiss belts, granite-greenstone belts, and significant gold and iron ore deposits. The Yilgarn Craton is older in the west and can be divided into several terranes, with the eastern regions hosting world-class gold deposits. The Pilbara Craton, on the other hand, consists of granitoid-greenstone terrain and is rich in banded iron formations, leading to the world's richest iron ore deposits in the Hamersley Basin. The Gascoyne Province forms the medium- to high-grade metamorphic core of the orogeny in the West Australian Element. The Albany-Fraser Orogen and Paterson Orogen joined the West Australian Element with the South Australian and North Australian Elements, respectively, and are characterised by metamorphosed rocks of various facies. The Pinjarra Orogen, situated to the west of the Yilgarn-Pilbara block, contains granulite and amphibolite facies orthogneisses. In the Phanerozoic era, sedimentary cover occurred in various large and smaller basins in Western Australia. The West Australian Element, along with the adjoining orogens, is treated as the West Australian fractured rock province, primarily reliant on weathered and fractured zones for groundwater storage due to low permeability. These cratons and orogens have been exposed since the Precambrian or Late Palaeozoic era, experiencing substantial weathering and river valley development. Modern palaeovalleys are mainly infilled with Cenozoic sediments, while arid conditions have reduced active watercourses, leading to an abundance of Aeolian sand cover. Many of these palaeovalleys are no longer active as rivers but can still be identified topographically. Overall, the geological history of Australia reveals a complex and diverse landscape, with Western Australia playing a significant role in hosting some of the continent's oldest rocks and valuable mineral deposits.
-
This McArthur Basin dataset contains descriptive attribute information for the areas bounded by the relevant spatial groundwater feature in the associated Hydrogeology Index map. Descriptive topics are grouped into the following themes: Location and administration; Demographics; Physical geography; Surface water; Geology; Hydrogeology; Groundwater; Groundwater management and use; Environment; Land use and industry types; and Scientific stimulus. The McArthur Basin, located in the north-east of the Northern Territory, is a Paleoproterozoic to Mesoproterozoic geological formation containing relatively undisturbed siliclastic and carbonate rocks, as well as minor volcanic and intrusive rocks. These sediments were primarily deposited in shallow marine environments, with some lacustrine and fluvial influences. The basin's thickness is estimated to be around 10,000 m to 12,000 m, potentially reaching 15,000 m in certain areas. It is known for hosting elements of at least two Proterozoic petroleum systems, making it a target for petroleum exploration, especially in the Beetaloo Sub-basin. Researchers have divided the McArthur Basin into five depositional packages based on similarities in age, lithofacies composition, stratigraphic position, and basin-fill geometry. These packages, listed from oldest to youngest, are the Wilton, Favenc, Glyde, Goyder, and Redback packages. The McArthur Basin is part of the broader Proterozoic basin system on the North Australian Craton, bounded by various inliers and extending under sedimentary cover in areas like the Arafura, Georgina, and Carpentaria basins. It is divided into northern and southern sections by the Urapunga Fault Zone, with significant structural features being the Walker Fault Zone in the north and the Batten Fault Zone in the south. The basin's southeastern extension connects with the Isa Superbasin in Queensland, forming the world's largest lead-zinc province. Overall, the McArthur Basin is an essential geological formation with potential petroleum resources, and its division into distinct packages helps in understanding its complex stratigraphy and geological history. Additionally, its connection with other basins contributes to a broader understanding of the region's geological evolution and resource potential.
-
This Ngalia Basin dataset contains descriptive attribute information for the areas bounded by the relevant spatial groundwater feature in the associated Hydrogeology Index map. Descriptive topics are grouped into the following themes: Location and administration; Demographics; Physical geography; Surface water; Geology; Hydrogeology; Groundwater; Groundwater management and use; Environment; Land use and industry types; and Scientific stimulus. The Ngalia Basin is an elongate, east-trending basin over 500 km long and 90 km wide. It occurs mostly in the Northern Territory, with limited occurrence in Western Australia. The Ngalia Basin is an intra-cratonic sedimentary basin in a structural downwarp formed by a faulted asymmetrical syncline. The basin began to form about 850 Ma, and contains a Neoproterozoic to Carboniferous sedimentary succession. Sedimentation ceased in response to the 450 to 300 Ma Alice Springs Orogeny. The maximum stratigraphic thickness of the Ngalia Basin is about 5000 m. The basin contains mainly arenaceous sedimentary rocks, with lesser fine-grained rock types and some carbonates. Fining upwards sedimentary cycles are commonly preserved and capped by calcite-cemented fine-grained sandstone and siltstone. Tectonic events disrupted deposition during basin evolution and led to at least ten unconformities. There are many disconformable contacts, with angular unconformities common in areas with abundant faulting. The upper-most arkosic sandstone formations in the Ngalia Basin are the Mount Eclipse Sandstone and the Kerridy Sandstone. These units have an aggregate thickness of several hundreds of metres and are the main aquifers within the Ngalia Basin sequence. There is some interstitial porosity, especially in the Mount Eclipse Sandstone, although joints and fissures associated with faulting provide significant secondary permeability. These aquifers provide good supplies of potable to brackish groundwater, and supply the community borefield at Yuendumu. The Ngalia Basin is almost entirely concealed by Cenozoic cover, including Palaeogene-Neogene palaeovalley, lake and alluvial fan sediment systems and Quaternary aeolian sands. Shallow aquifers with brackish to potable water occur in many palaeovalleys sediments overlying the basin.