satellite
Type of resources
Keywords
Publication year
Service types
Scale
Topics
-
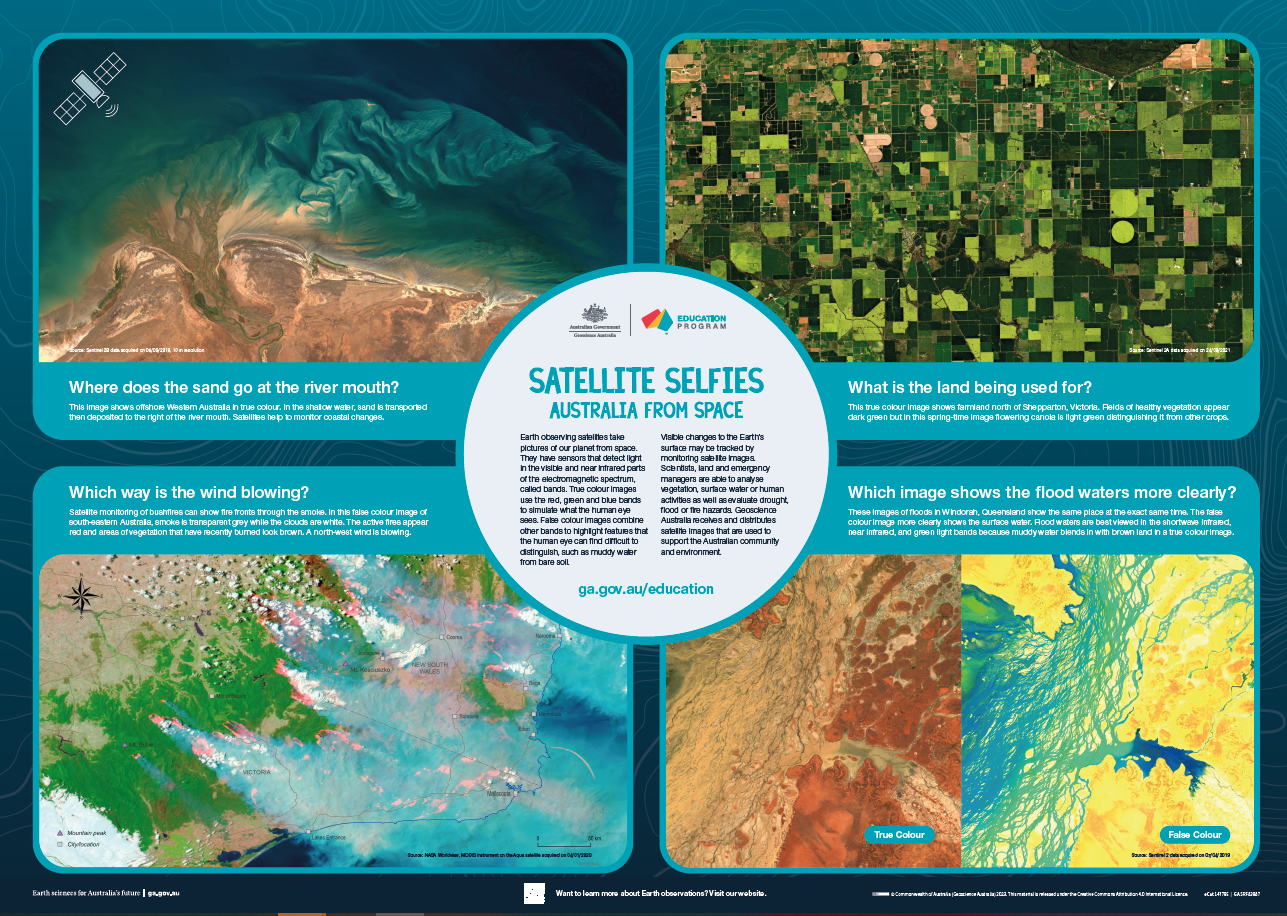
<div>The A1 poster incorporates 4 images of Australia taken from space by Earth observing satellites. The accompanying text briefly introduces sensors and the bands within the electromagnetic spectrum. The images include examples of both true and false colour and the diverse range of applications of satellite images such as tracking visible changes to the Earth’s surface like crop growth, bushfires, coastal changes and floods. Scientists, land and emergency managers use satellite images to analyse vegetation, surface water or human activities as well as evaluate natural hazards.</div>
-
Gravity data measure small changes in gravity due to changes in the density of rocks beneath the Earth's surface. The data collected are processed via standard methods to ensure the response recorded is that due only to the rocks in the ground. The results produce datasets that can be interpreted to reveal the geological structure of the sub-surface. The processed data is checked for quality by GA geophysicists to ensure that the final data released by GA are fit-for-purpose. This National Gravity Compilation 2019 includes airborne - CSCBA 0.5VD image is derived from the 2019 Australian National Gravity Grids B series. These gravity data were acquired under the project No. 202008. The grid has a cell size of 0.00417 degrees (approximately 435m). This gravity anomaly grid is derived from ground observations stored in the Australian National Gravity Database (ANGD) as at September 2019, supplemented by offshore data sourced from v28.1 of the Global Gravity grid developed using data from the Scripps Institution of Oceanography, the National Oceanic and Atmospheric Administration (NOAA), and National Geospatial-Intelligence Agency (NGA) at Scripps Institution of Oceanography, University of California San Diego. Airborne gravity and gravity gradiometry data were also included to provide better resolution to areas where ground gravity data was not of a suitable quality. Out of the approximately 1.8 million gravity observations, nearly 1.4 million gravity stations in the ANGD together with Airborne Gravity surveys totaling 345,000 line km and 106,000 line km of Airborne Gravity Gradiometry were used to generate this grid. The ground and airborne gravity data used in this grid has been acquired by the Commonwealth, State and Territory Governments, the mining and exploration industry, universities and research organisations from the 1940's to the present day. Station spacing varies from approximately 11 km down to less than 1 km, with major parts of the continent having station spacing between 2.5 and 7 km. Airborne surveys have a line spacing ranging from 0.5 km to 2.5 km. Terrain corrections to gravity were calculated using both offshore bathymetry and onshore topography data. The image shows a half vertical derivative of the complete Bouguer anomalies (B series) over Australia and its continental margins. A half vertical derivative was calculated by applying a fast Fourier transform (FFT) process to the complete spherical cap Bouguer anomaly grid of the 2019 Australian National Gravity Grids B series.
-
ACRES Technical Document - Landsat MSS Data Format Description. Table of Contents.
-
The product SAR.GEC is a digital image generated from raw SAR data takes using up-to-date auxiliary parameters, with the best available instrubmental corrections applied, precisely located and recified onto a map projection. The ESA SAR.GEC format is based on teh general definistion of the SAR CEOS format (ref. ER-IS-EPO-GS-5902).
-
Significant advances in regional exploration and surface materials mapping are possible using spectral data and specialized remote sensing methods. Benefits for mineral explorers, land-users, government and university researchers are now available using improved ASTER calibration techniques. HyMap and ASTER calibration, processing and standardisation approaches have been produced as part of a large multi agency project to facilitate uptake of these techniques and make them easily integrated with other datasets in a GIS. Collaborative research comprising Geoscience Australia, the Commonwealth Scientific Research Organisation (CSIRO) and state and industry partners, on the world-class Mt Isa mineral province in Queensland was completed in 2008 as a test-case for some new methods. The project demonstrated that geochemical information about mineral deposit 'footprints' and alteration chemistry can be acquired by analysing spectral ground response, particularly in the short-wave infra-red. Key materials that can be identified include clays and magnesium/ iron/ aluminium oxyhydroxides, as well as information on mineral composition, abundance and physicochemistries (including crystallinity) for minerals such as kaolinite, which can be used as a surrogate for identifying transported versus in situ regolith material. The identification and classification of regolith materials and thickness indicators is essential to facilitate on-going exploration in many challenging regions such as South Australia.
-
This document describes a format of the AVNIR-2 (Advanced Bisible Near-Infrared Radiometer) products generaged by the ALOS Data Processing Subsystem.
-
The product SAR.GEC is a digital image generated from raw SAR data takes using up-to-date auxiliary parameters, with the best available instrumental corrections applied, precisely located and rectified onto a map projection. The JERS SAR.GEC format is based on the general definition of the SAR CEOS format (ref. ER-IS-EPS-GS-5902).
-
This document is the Data Format Control Book (DFCB) for the Landsat 7 (L7) Enhanced Thematic Mapper Plus (EMT+) Level Zero-R Distribution Product (LORp). It focuses on the Hierarchical Data Format (HDF) of the Landsat 7 L0R product available from the Centre for Earth Resources Observation and Science (EROS) Landsat Archive Manager (LAM).
-
This is an extract from the ACRES Landsat Digital Data Format Document.

