Hazard
Type of resources
Keywords
Publication year
Service types
Topics
-
Severe TC Vance was one of the most intense cyclones to impact mainland Australia. The observed damage to buildings could be explained in terms of structural performance of those buildings. Combining the structural vulnerability of housing with an estimate of the maximum wind gusts, we can explore the possible impacts that a repeat of Vance would cause in Exmouth, and compare the outcomes with what occurred in 1999. The analysis of the impacts of TC Vance on present-day Exmouth shows that very few houses would be completely destroyed. Not surprisingly, older houses (pre-1980’s construction era, excluding the US Navy block houses) would dominate those destroyed, and most likely the timber-framed style houses, many of which were substantially damaged in TC Vance.
-
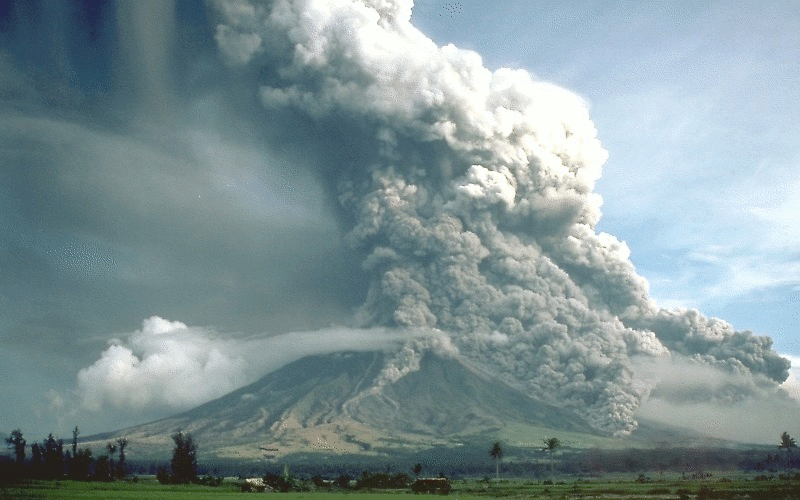
Activity for secondary and senior secondary students examining a hypothetical city and its vulnerability to volcanic hazard risk. Includes background information for teachers, PowerPoint presentation, student activity sheet and worked answers.
-
As part of the 2018 Tropical Cyclone Hazard Assessment (TCHA), we compiled the geospatial raster dataset that can be accessible to internal and external users via ArcGIS online and can be integrated for building additional geoprocessing applications. This web service gives more stable and easy access to data and interactive maps. With having separate geospatial layers for each recurrence interval- i.e. 5 through 10000 years, users can toggle between the layers and evaluate the changes in wind speed (km/hr) and potential areas at risk on the fly.
-
Data used to generate the National Seismic Hazard Assessments (NSHA). Data includes: original and modified earthquake catalogues, earthquake rate models, probabilistic seismic hazard outputs. The most recent assessment was completed in 2018 and can be viewed on Geoscience Australia's <a href="http://www.ga.gov.au/about/projects/safety/nsha">National Seismic Hazard Assessment (NSHA) Internet Page</a> <b>Value: </b> Data used to generate the NSHA <b>Scope: </b>Continental scale
-
An evaluation of the likelihood of tropical cyclone-related extreme winds, incorporating local effects on wind speed.
-
Hot emissions of mainly sulphur dioxide and carbon dioxide took place from a mound in Koranga open cut, near Wau, following a landslide at the end of May, 1967. Rocks of the Holocene volcano, Koranga, are exposed in the open cut. The emissions lasted about three months, and ceased on 13 August after another landslide removed the active mound. During the period of activity, recorded temperatures ranged up to 680°C; no anomalous seismic or tilt phenomena were recorded. The cause of the activity is not known, but it is thought that the high temperatures and gases may have been the result of the spontaneous combustion of reactive sulphides and carbonaceous material present in the altered rocks of Koranga volcano.
-
The Greater Metro Manila Area is one of the world's megacities and is home to about 12 million people. It is located in a region at risk from earthquakes, volcanic eruptions, tropical cyclones, riverine flooding, landslides and other natural hazards. Major flooding affected the Greater Metro Manila Area in September 2009 following the passage of Typhoon Ketsana (known locally as Typhoon Ondoy). Following this event, the Australian Aid Program supported Geoscience Australia to undertake a capacity building project with its partner agencies in the Government of the Philippines. The output of this project has been a series of risk information products developed by agencies in the Collective Strengthening of Community Awareness for Natural Disasters (CSCAND) group. These products quantify the expected physical damage and economic loss to buildings caused by earthquakes, tropical cyclone severe wind and riverine flooding across the Greater Metro Manila Area. Spatial data is a key input to the development of hazard models and information on exposure, or the 'elements at risk'. The development of a spatially enabled exposure database was a crucial element in the construction of risk information products for the Greater Metro Manila Area. The database provides one central repository to host consistent information about the location, size, type, age, residential population and structural characteristics of buildings within the area of interest. Unique spatial analysis techniques were employed to quantify and record important aspects of the built environment, for inclusion in the database. The process of exposure data development within the Greater Metro Manila Area, including a new application developed by Geoscience Australia for estimating the geometric characteristics of buildings from high resolution elevation data and multi-spectral imagery, will be presented.
-
Tsunami hazard modelling for Tonga shows the potential impacts of tsunami generated by a very large earthquake on the nearby Tongan Trench.
-
Through Australian Department of Foreign Affairs and Trade, Geoscience Australia has been working closely with the Government of Papua New Guinea technical agencies (Rabaul Volcano Observatory, Port Moresby Geophysical Observatory, and Engineering Geology Branch) since September 2010 to enhance their capabilities to monitor and assess natural hazards. The objective of this program is to support the Government of Papua New Guinea in developing fundamental information and practices for the effective response and management of natural hazard events in PNG. Earthquakes as natural hazards are one of the key focus points of this project, as they continue to cause loss of life and widespread damage to buildings and infrastructure in Papua New Guinea. The country’s vulnerability to earthquakes is evident from the significant socio-economic consequences of recent major events in Papua New Guinea, e.g., a magnitude 7.5 earthquake that occurred in the Hela Province of Papua New Guinea in 2018. Earthquake risk is likely to increase significantly in the years to come due to the growth in population and urbanization in Papua New Guinea. However, earthquake risk, unlike hazard, can be managed and minimized. One obvious example would be minimizing earthquake risk by constructing earthquake-resistant structures following building standards. The high level of earthquake hazard of Papua New Guinea has been long recognised and the suite of building standards released in 1982 contained provisions to impart adequate resilience to buildings based on the best understanding of seismic hazard available at that time. However, the building standards and incorporated seismic hazard assessment for Papua New Guinea has not been updated since the 1980s. The integration of modern national seismic hazard models into national building codes and practices provides the most effective way that we can reduce human casualties and economic losses from future earthquakes. This report aims at partially fulfilling this task by performing a probabilistic seismic hazard assessment to underpin a revision of the earthquake loading component of the building standards of Papua New Guinea. The updated assessment offers many important advances over its predecessor. It is based on a modern probabilistic hazard framework and considers an earthquake catalogue augmented with an additional four decades-worth of data. The revised assessment considers advances in ground-motion modelling through the use of multiple ground-motion models. Also, for the first time, the individual fault sources representing active major and microplate boundaries are implemented in the input hazard model. Furthermore, the intraslab sources are represented realistically by using the continuous slab volume to constrain the finite ruptures of such events. This would better constrain the expected levels of ground motion at any given site in Papua New Guinea. The results suggest a high level of hazard in the coastal areas of the Huon Peninsula and the New Britain–Bougainville region, and a relatively low level of hazard in the southern part of the New Guinea Highlands Block. In comparison with the seismic zonation map in the current design standard, it can be noted that the spatial distribution used for building design does not match the bedrock hazard distribution of this study. In particular, the high seismic hazard of the Huon Peninsula in the revised assessment is not captured in the current seismic zoning map, leading to a significant under-estimation of hazard in PNG’s second-largest city, Lae. It can also be shown that in many other regions and community localities in PNG the hazard is higher than that regulated for the design of buildings having a range of natural periods. Thus, the need for an updated hazard map for building design has been confirmed from the results of this study, and a revised map is developed for consideration in a revised building standard of Papua New Guinea.
-
In November, 2018 a workshop of experts sponsored by UNESCO’s Intergovernmental Oceanographic Commission was convened in Wellington, New Zealand. The meeting was organized by Working Group (WG) 1 of the Pacific Tsunami Warning System (PTWS). The meeting brought together fourteen experts from various disciplines and four different countries (New Zealand, Australia, USA and French Polynesia) and four observers from Pacific Island countries (Tonga, Fiji), with the objective of understanding the tsunami hazard posed by the Tonga-Kermadec trench, evaluating the current state of seismic and tsunami instrumentation in the region and assessing the level of readiness of at-risk populations. The meeting took place in the “Beehive” Annex to New Zealand’s Parliament building nearby the offices of the Ministry of Civil Defence and Emergency Management. The meeting was co-chaired by Mrs. Sarah-Jayne McCurrach (New Zealand) from the Ministry of Civil Defence and Emergency Management and Dr. Diego Arcas (USA) from NOAA’s Pacific Marine Environmental Laboratory. As one of the meeting objectives, the experts used their state-of-the-science knowledge of local tectonics to identify some of the potential, worst-case seismic scenarios for the Tonga-Kermadec trench. These scenarios were ranked as low, medium and high probability events by the same experts. While other non-seismic tsunamigenic scenarios were acknowledged, the level of uncertainty in the region, associated with the lack of instrumentation prevented the experts from identifying worse case scenarios for non-seismic sources. The present report synthesizes some of the findings of, and presents the seismic sources identified by the experts to pose the largest tsunami risk to nearby coastlines. In addition, workshop participants discussed existing gaps in scientific knowledge of local tectonics, including seismic and tsunami instrumentation of the trench and current level of tsunami readiness for at-risk populations, including real-time tsunami warnings. The results and conclusions of the meeting are presented in this report and some recommendations are summarized in the final section.