Geophysical National Coverage
Type of resources
Keywords
Publication year
Distribution Formats
Scale
Topics
-
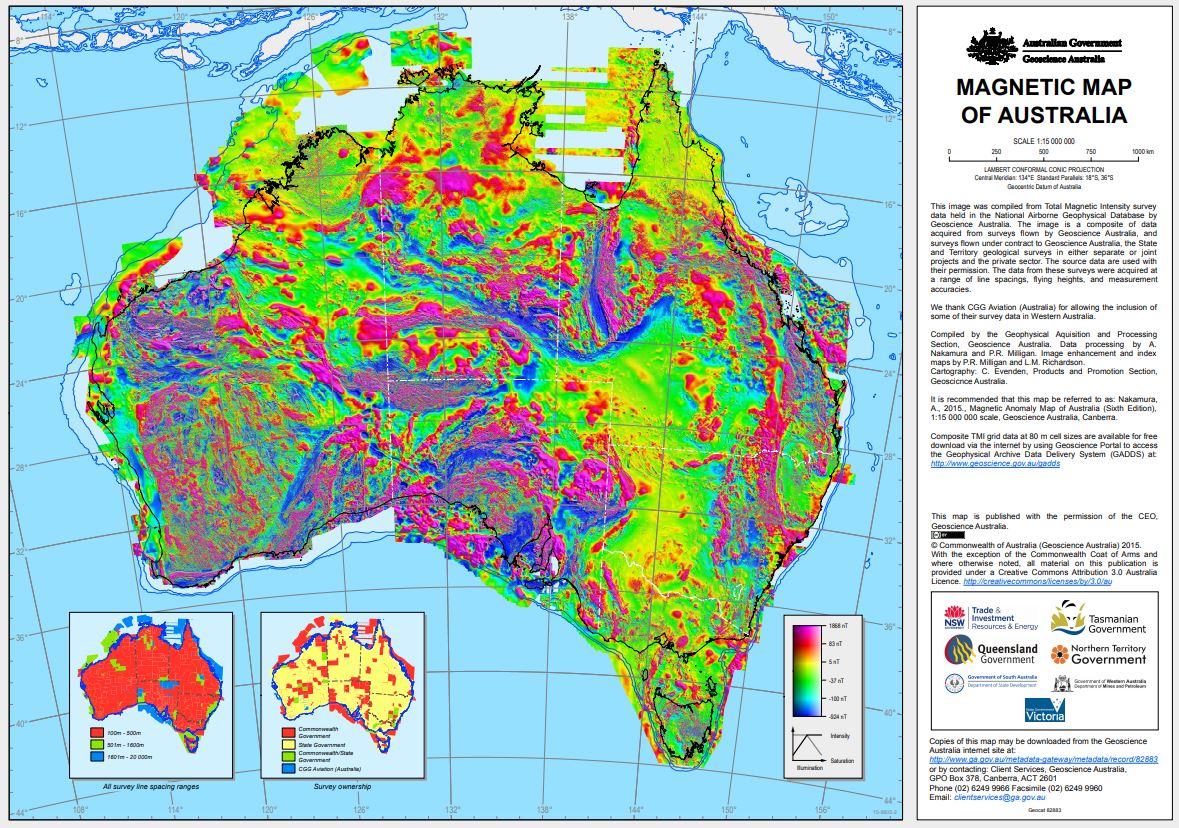
Total Magnetic Intensity colour composite image 2015 The image was created from the Total Magnetic Intensity Grid 2015 - sixth edition. This image has a cell size of ~3 seconds of arc (approximately 80 m) and has been image enhanced for optimal display in Hue-Saturation-Intensity (HSI). This image only includes airborne-derived TMI data for onshore and near-offshore continental areas. Since the fifth edition was released in 2010 data from 41 new surveys have been added to the database, acquired mainly by the State and Territory Geological Surveys. It is estimated that 31 500 000 line-kilometres of survey data were acquired to produce the grid data, 4 500 000 line-kilometres more than for the previous edition.
-
Total magnetic intensity (TMI) data measures variations in the intensity of the Earth magnetic filed caused by the contrasting content of rock-forming minerals in the Earth crust. Magnetic anomalies can be either positive (field stronger than normal) or negative (field weaker) depending on the susceptibility of the rock. This TMI image is created from the 2015 magnetic grid of the Australian region with a grid cell size of ~3 seconds of arc (approximately 80 m). This image only includes airborne-derived TMI data for onshore and near-offshore continental areas. The image shows the magnetic response of subsurface features with contrasting magnetic susceptibilities. The image can also be used to locate structural features such as dykes.
-
Gravity Anomaly image 2009 (Colour Composite Image) This image is made from a grid that represents gravity anomalies of the Australian region. The grid combines accurate onshore gravity measurements, with satellite data over the offshore region. The cell values represent simple Bouguer anomalies at a density of 2.67 tonnes per cubic metre onshore and free-air anomalies offshore. The grid cell size is 0.5 minutes of arc, which is equivalent to approximately 800 metres.
-
Total Magnetic Intensity (TMI) Anomaly Image of Australia with Variable Reduction to Pole (VRTP) greyscale Total magnetic intensity (TMI) data measures variations in the intensity of the Earth magnetic filed caused by the contrasting content of rock-forming minerals in the Earth crust. Magnetic anomalies can be either positive (field stronger than normal) or negative (field weaker) depending on the susceptibility of the rock. A variable reduction to Pole is aimed at locating magnetic anomalies exactly above their source bodies and without any distortion. The image is created from the 2015 variable reduction to Pole of the TMI grid with a grid cell size of ~3 seconds of arc (approximately 80 m). This image only includes airborne-derived TMI data for onshore and near-offshore continental areas. The image provides a better interpretation of the magnetic data by giving an accurate location of magnetic source bodies.
-
This image is a greyscale image of the Total Magnetic Intensity of Australia. Total magnetic intensity (TMI) data measures variations in the intensity of the Earth magnetic filed caused by the contrasting content of rock-forming minerals in the Earth crust. Magnetic anomalies can be either positive (field stronger than normal) or negative (field weaker) depending on the susceptibility of the rock. The image is created from the 2019 TMI grid with a grid cell size of ~3 seconds of arc (approximately 80 m). This image only includes airborne-derived TMI data for onshore and near-offshore continental areas. The image shows the magnetic response of subsurface features with contrasting magnetic susceptibilities. The image can also be used to locate structural features such as dykes.
-
Filtered Dose - Terrestrial dose rate derived as a linear combination of the filtered K, U and Th grids described in Minty et al. (2009), units: nG/h The Radiometric Map of Australia dataset comprises grids of potassium (K), uranium (U) and thorium (Th) element concentrations, and derivatives of these grids. The third edition was derived by seamlessly merging 45 new survey grids with the Second Edition Radiometric Map of Australia (Minty et al., 2010). Details of the specifications of individual airborne surveys can be found in the Fourteenth Edition of the Index of Airborne Geophysical Surveys (Percival, 2014), which is included with the grid as a PDF document. This Index is also available online at http://pid.geoscience.gov.au/dataset/ga/79134. Further up to date information about individual surveys can also be obtained online from the Airborne Surveys Database at http://www.ga.gov.au/oracle/argus/. Matching of the grids in the database was achieved using a program called Gridmerge, which was originally developed within Geoscience Australia and has now been commercialised. This program was used to merge 45 new surveys to the Second Edition Radiometric Map of Australia. The second edition merged over 550 individual grids to create the compilation (Minty et al., 2009) and the Australia-wide Airborne Geophysical Survey (AWAGS) airborne radiometric data was used to control the base levels of those survey grids which overlapped the AWAGS data (Milligan et al., 2009). As the second edition was used as a base grid for the Gridmerge operation the new Third Edition is essentially levelled to AWAGS. Cell sizes: The cell sizes of the original survey grids range from 50 m through 800 m, but most have a cell size of about 100 m. The 45 original survey grids were levelled and then re-sampled, using Newton 4th Order local operator onto the Second Edition Radiometric Map of Australia Grids with a cell size of about 100m (0.001 degrees). Filtering: Potassium, uranium, thorium and dose rate grid are available in both filtered and unfiltered versions. The low-pass filtering was achieved by applying a 7-point, degree-3 Savitzky-Golay filter (Savitzky & Golay, 1964) to each of the original survey grids prior to grid merging. Projections and Datums: The grids are stored as geodetic grids based on the GDA94 datum, but can be re-projected prior to downloading. Grid downloads: The Radiometric Map of Australia grids can be downloaded using the Geophysical Archive Data Delivery System (GADDS) on the Australian Government's Geoscience Portal at http://www.geoscience.gov.au/gadds File sizes: At full resolution, each Radiometric Map of Australia grid has 34761 rows and 40954 columns. Each grid has a file size of approximately 5.3 Gb in ERMapper format. Note that, because of the file sizes, GADDS will not allow users to do download the grids at full resolution. Users wishing to access the grids at full resolution should contact Geoscience Australia to make arrangements to have the data supplied on a portable hard drive.
-
Ratio U2/Th - Ratio of U2 over Th derived from the filtered U and Th grids, units: dimensionless The Radiometric Map of Australia dataset comprises grids of potassium (K), uranium (U) and thorium (Th) element concentrations, and derivatives of these grids. The third edition was derived by seamlessly merging 45 new survey grids with the Second Edition Radiometric Map of Australia (Minty et al., 2010). Details of the specifications of individual airborne surveys can be found in the Fourteenth Edition of the Index of Airborne Geophysical Surveys (Percival, 2014), which is included with the grid as a PDF document. This Index is also available online at http://pid.geoscience.gov.au/dataset/ga/79134. Further up to date information about individual surveys can also be obtained online from the Airborne Surveys Database at http://www.ga.gov.au/oracle/argus/. Matching of the grids in the database was achieved using a program called Gridmerge, which was originally developed within Geoscience Australia and has now been commercialised. This program was used to merge 45 new surveys to the Second Edition Radiometric Map of Australia. The second edition merged over 550 individual grids to create the compilation (Minty et al., 2009) and the Australia-wide Airborne Geophysical Survey (AWAGS) airborne radiometric data was used to control the base levels of those survey grids which overlapped the AWAGS data (Milligan et al., 2009). As the second edition was used as a base grid for the Gridmerge operation the new Third Edition is essentially levelled to AWAGS. Cell sizes: The cell sizes of the original survey grids range from 50 m through 800 m, but most have a cell size of about 100 m. The 45 original survey grids were levelled and then re-sampled, using Newton 4th Order local operator onto the Second Edition Radiometric Map of Australia Grids with a cell size of about 100m (0.001 degrees). Filtering: Potassium, uranium, thorium and dose rate grid are available in both filtered and unfiltered versions. The low-pass filtering was achieved by applying a 7-point, degree-3 Savitzky-Golay filter (Savitzky & Golay, 1964) to each of the original survey grids prior to grid merging. Projections and Datums: The grids are stored as geodetic grids based on the GDA94 datum, but can be re-projected prior to downloading. Grid downloads: The Radiometric Map of Australia grids can be downloaded using the Geophysical Archive Data Delivery System (GADDS) on the Australian Government's Geoscience Portal at http://www.geoscience.gov.au/gadds File sizes: At full resolution, each Radiometric Map of Australia grid has 34761 rows and 40954 columns. Each grid has a file size of approximately 5.3 Gb in ERMapper format. Note that, because of the file sizes, GADDS will not allow users to do download the grids at full resolution. Users wishing to access the grids at full resolution should contact Geoscience Australia to make arrangements to have the data supplied on a portable hard drive.
-
Ratio U/Th - Ratio of U over Th derived from the filtered U and Th grids, units: dimensionless The Radiometric Map of Australia dataset comprises grids of potassium (K), uranium (U) and thorium (Th) element concentrations, and derivatives of these grids. The third edition was derived by seamlessly merging 45 new survey grids with the Second Edition Radiometric Map of Australia (Minty et al., 2010). Details of the specifications of individual airborne surveys can be found in the Fourteenth Edition of the Index of Airborne Geophysical Surveys (Percival, 2014), which is included with the grid as a PDF document. This Index is also available online at http://pid.geoscience.gov.au/dataset/ga/79134. Further up to date information about individual surveys can also be obtained online from the Airborne Surveys Database at http://www.ga.gov.au/oracle/argus/. Matching of the grids in the database was achieved using a program called Gridmerge, which was originally developed within Geoscience Australia and has now been commercialised. This program was used to merge 45 new surveys to the Second Edition Radiometric Map of Australia. The second edition merged over 550 individual grids to create the compilation (Minty et al., 2009) and the Australia-wide Airborne Geophysical Survey (AWAGS) airborne radiometric data was used to control the base levels of those survey grids which overlapped the AWAGS data (Milligan et al., 2009). As the second edition was used as a base grid for the Gridmerge operation the new Third Edition is essentially levelled to AWAGS. Cell sizes: The cell sizes of the original survey grids range from 50 m through 800 m, but most have a cell size of about 100 m. The 45 original survey grids were levelled and then re-sampled, using Newton 4th Order local operator onto the Second Edition Radiometric Map of Australia Grids with a cell size of about 100m (0.001 degrees). Filtering: Potassium, uranium, thorium and dose rate grid are available in both filtered and unfiltered versions. The low-pass filtering was achieved by applying a 7-point, degree-3 Savitzky-Golay filter (Savitzky & Golay, 1964) to each of the original survey grids prior to grid merging. Projections and Datums: The grids are stored as geodetic grids based on the GDA94 datum, but can be re-projected prior to downloading. Grid downloads: The Radiometric Map of Australia grids can be downloaded using the Geophysical Archive Data Delivery System (GADDS) on the Australian Government's Geoscience Portal at http://www.geoscience.gov.au/gadds File sizes: At full resolution, each Radiometric Map of Australia grid has 34761 rows and 40954 columns. Each grid has a file size of approximately 5.3 Gb in ERMapper format. Note that, because of the file sizes, GADDS will not allow users to do download the grids at full resolution. Users wishing to access the grids at full resolution should contact Geoscience Australia to make arrangements to have the data supplied on a portable hard drive.
-
Ratio of U over K derived from the filtered U and K grids, units: dimensionless The Radiometric Map of Australia dataset comprises grids of potassium (K), uranium (U) and thorium (Th) element concentrations, and derivatives of these grids. The third edition was derived by seamlessly merging 45 new survey grids with the Second Edition Radiometric Map of Australia (Minty et al., 2010). Details of the specifications of individual airborne surveys can be found in the Fourteenth Edition of the Index of Airborne Geophysical Surveys (Percival, 2014), which is included with the grid as a PDF document. This Index is also available online at http://pid.geoscience.gov.au/dataset/ga/79134. Further up to date information about individual surveys can also be obtained online from the Airborne Surveys Database at http://www.ga.gov.au/oracle/argus/. Matching of the grids in the database was achieved using a program called Gridmerge, which was originally developed within Geoscience Australia and has now been commercialised. This program was used to merge 45 new surveys to the Second Edition Radiometric Map of Australia. The second edition merged over 550 individual grids to create the compilation (Minty et al., 2009) and the Australia-wide Airborne Geophysical Survey (AWAGS) airborne radiometric data was used to control the base levels of those survey grids which overlapped the AWAGS data (Milligan et al., 2009). As the second edition was used as a base grid for the Gridmerge operation the new Third Edition is essentially levelled to AWAGS. Cell sizes: The cell sizes of the original survey grids range from 50 m through 800 m, but most have a cell size of about 100 m. The 45 original survey grids were levelled and then re-sampled, using Newton 4th Order local operator onto the Second Edition Radiometric Map of Australia Grids with a cell size of about 100m (0.001 degrees). Filtering: Potassium, uranium, thorium and dose rate grid are available in both filtered and unfiltered versions. The low-pass filtering was achieved by applying a 7-point, degree-3 Savitzky-Golay filter (Savitzky & Golay, 1964) to each of the original survey grids prior to grid merging. Projections and Datums: The grids are stored as geodetic grids based on the GDA94 datum, but can be re-projected prior to downloading. Grid downloads: The Radiometric Map of Australia grids can be downloaded using the Geophysical Archive Data Delivery System (GADDS) on the Australian Government's Geoscience Portal at http://www.geoscience.gov.au/gadds File sizes: At full resolution, each Radiometric Map of Australia grid has 34761 rows and 40954 columns. Each grid has a file size of approximately 5.3 Gb in ERMapper format. Note that, because of the file sizes, GADDS will not allow users to do download the grids at full resolution. Users wishing to access the grids at full resolution should contact Geoscience Australia to make arrangements to have the data supplied on a portable hard drive.
-
Low-pass filtered U element concentrations, units: ppm eU The Radiometric Map of Australia dataset comprises grids of potassium (K), uranium (U) and thorium (Th) element concentrations, and derivatives of these grids. The third edition was derived by seamlessly merging 45 new survey grids with the Second Edition Radiometric Map of Australia (Minty et al., 2010). Details of the specifications of individual airborne surveys can be found in the Fourteenth Edition of the Index of Airborne Geophysical Surveys (Percival, 2014), which is included with the grid as a PDF document. This Index is also available online at http://pid.geoscience.gov.au/dataset/ga/79134. Further up to date information about individual surveys can also be obtained online from the Airborne Surveys Database at http://www.ga.gov.au/oracle/argus/. Matching of the grids in the database was achieved using a program called Gridmerge, which was originally developed within Geoscience Australia and has now been commercialised. This program was used to merge 45 new surveys to the Second Edition Radiometric Map of Australia. The second edition merged over 550 individual grids to create the compilation (Minty et al., 2009) and the Australia-wide Airborne Geophysical Survey (AWAGS) airborne radiometric data was used to control the base levels of those survey grids which overlapped the AWAGS data (Milligan et al., 2009). As the second edition was used as a base grid for the Gridmerge operation the new Third Edition is essentially levelled to AWAGS. Cell sizes: The cell sizes of the original survey grids range from 50 m through 800 m, but most have a cell size of about 100 m. The 45 original survey grids were levelled and then re-sampled, using Newton 4th Order local operator onto the Second Edition Radiometric Map of Australia Grids with a cell size of about 100m (0.001 degrees). Filtering: Potassium, uranium, thorium and dose rate grid are available in both filtered and unfiltered versions. The low-pass filtering was achieved by applying a 7-point, degree-3 Savitzky-Golay filter (Savitzky & Golay, 1964) to each of the original survey grids prior to grid merging. Projections and Datums: The grids are stored as geodetic grids based on the GDA94 datum, but can be re-projected prior to downloading. Grid downloads: The Radiometric Map of Australia grids can be downloaded using the Geophysical Archive Data Delivery System (GADDS) on the Australian Government's Geoscience Portal at http://www.geoscience.gov.au/gadds File sizes: At full resolution, each Radiometric Map of Australia grid has 34761 rows and 40954 columns. Each grid has a file size of approximately 5.3 Gb in ERMapper format. Note that, because of the file sizes, GADDS will not allow users to do download the grids at full resolution. Users wishing to access the grids at full resolution should contact Geoscience Australia to make arrangements to have the data supplied on a portable hard drive.