GEOPHYSICS
Type of resources
Keywords
Publication year
Topics
-
Geoscience Australia commissioned reprocessing of selected legacy onshore 2D reflection seismic data in the Kidson Sub-basin of the Canning Basin, Cobb Embayment in the SE Canning Basin, NW Canning Basin, and Southern Carnarvon, Western Australia. This reprocessing is a collaboration between the Geoscience Australia Exploring for the Future (EFTF) program and The Government of Western Australia, Department of Mines, Industry Regulation and Safety, Exploration Incentive Scheme (EIS). Reprocessing was carried out by Ion (Cairo) between January 2018 and September 2018. The Canning project comprised 30 lines from 5 vintages of data totalling 1412 km. The Carnarvon project comprised 36 lines from 6 vintages of data totalling 1440 km. This reprocessing is intended to produce an improved quality seismic dataset that will increase confidence in the mapping of the structure and stratigraphy of the onshore sedimentary basins of Western Australia. The new seismic reprocessed data is being made available as pre-competitive information to assist industry to better target areas likely to contain the next major oil, gas and mineral deposits. <b>Processed data for this survey are available on request from clientservices@ga.gov.au - Quote eCat# 144258</b>
-
<p>Seawater intrusion (SWI) has become a serious threat to many groundwater resources in the last decades, especially in the areas of overexploitation due to population increase, or agriculture use. Significant attention was therefore brought to this complex groundwater problem in order to improve management of these affected aquifers. <p>Due to the high conductivity of seawater, SWI is a good target for many geophysical electromagnetic methods, such as airborne electromagnetic (AEM) or direct current resistivity methods. Airborne collected data are able to map extensive areas, and thus map the extent of SWI on a large scale along the coastlines. <p>However, zooming into a smaller scale, a discrepancy is often found between geophysical estimates and groundwater borehole data, due to different resolution, data sensitivity and also quality of geophysical and groundwater data. Numerous synthetic studies have shown the benefit of approaching the problem by evaluating both types of data in somewhat jointly manner. Research in combining the field geophysical and groundwater data for SWI cases is however very limited. <p>In this contribution we look at the AEM survey in Keep river, NT. It is a dense line survey with spacing of 100m, collected by SKyTEM 312 system for Geoscience Australia. Due to the character of AEM methods, the estimation of 3D (or 2D) subsurface conductivity is mathematically an ill-posed problem, giving multiple “equally good” models (here soil bulk conductivity) with the same data misfit. <p>The borehole data from this area together with geological mapping provide limited (1D) but valuable information about the seawater intrusion location and extent. We applied this “a priori” information coming from direct groundwater data to invert the selected lines of AEM data to obtain estimates that fit well the geophysical data but are also plausible with regard to geology and groundwater chemistry data.
-
Collection of Geoscience Australia's high-resolution elevation surveys collected using Light Detection and Ranging (LiDAR) and other instrument systems. <b>Value: </b>Describes Australia's landforms and seabed is crucial for addressing issues relating to the impacts of climate change, disaster management, water security, environmental management, urban planning and infrastructure design. <b>Scope: </b>Selected areas of interest around Australia.
-
This collection includes calibrated time-series data and other products from Geoscience Australia's geomagnetic observatory network in Australia and Antarctica. Data dates back to 1924. <b>Value: </b>These data are used in mathematical models of the geomagnetic field, in resource exploration and exploitation, to monitor space weather, and for scientific research. The resulting information can be used for compass-based navigation, magnetic direction finding, and to help protect communities by mitigating the potential hazards generated by magnetic storms. <b>Scope: </b>Continuous geomagnetic time series data, indices of magnetic activity and associated metadata, Data dates back to 1924.
-
We have developed a Bayesian inference algorithm and released open-source code for the 1D inversion of audio-frequency magnetotelluric data. The algorithm uses trans-dimensional Markov chain Monte Carlo to solve for a probabilistic resistivity-depth model. The inversion employs multiple Markov chains in parallel to generate an ensemble of millions of resistivity models that adequately fit the data given the assigned noise levels. The trans-dimensional aspect of the inversion means that the number of layers in the resistivity model is solved for rather than being predetermined. The inversion scheme favours a parsimonious solution, and the acceptance criterion ratio is theoretically derived such that the Markov chain will eventually converge to an ensemble that is a good approximation of the posterior probability density (PPD). Once the ensemble of models is generated, its statistics are analysed to assess the PPD and to quantify model uncertainties. This approach gives a thorough exploration of model space and a more robust estimation of uncertainty than deterministic methods allow. We demonstrate the application of the method to cover thickness estimation for a number of regional drilling programs. Comparison with borehole results demonstrates that the method is capable of identifying major stratigraphic structures with resistivity contrasts. Our results have assisted with drill site targeting, and have helped to reduce the uncertainty and risk associated with intersecting targeted stratigraphic units in covered terrains. Interpretation of the audio-frequency magnetotelluric data has also improved our understanding of the distribution and geometries of sedimentary basins undercover. From an exploration perspective, mapping sedimentary basins and covered near-surface geological features supports the effective search for mineral deposits in greenfield areas. <b>Citation: </b> Wenping Jiang, Ross C. Brodie, Jingming Duan, Ian Roach, Neil Symington, Anandaroop Ray, James Goodwin, Probabilistic inversion of audio-frequency magnetotelluric data and application to cover thickness estimation for mineral exploration in Australia, <i>Journal of Applied Geophysics</i>, Volume 208, 2023, 104869, ISSN 0926-9851, https://doi.org/10.1016/j.jappgeo.2022.104869.
-
This set of explanatory notes provided the process of creating the 2019 National Gravity Grids released September 2020. This information provides a step by step guide to the processing sequence undertaken. The Notes provide: 1) the data sources for the grids, such as Geoscience Australia's National Airborne Geophysics Database (NAGD), the Australian National Gravity Database (ANGD), and Sandwell and Smith (v28p1) satellite gravity data. 2) Equations used to reduce gravity, gridding calculations, and observation surface for the "B" series grids, 3) Step by step processing sequence. There is also a section with a simple aid to interpreting the grids. The grids are available either as a complete set of grids, or individually, from the associated link. Links: https://ecat.ga.gov.au/geonetwork/srv/eng/catalog.search#/metadata/133023
-
Drilling in the Geoscience Australia Exploring for the Future East Tennant project was conducted as part of the MinEx CRC National Drilling Initiative. Ten stratigraphic boreholes were drilled for scientific purposes in the region around the Barkly Roadhouse in the Northern Territory. Where possible, the boreholes were comprehensively wireline logged to obtain petrophysical data on the cover and basement rocks to help improve knowledge and geophysical models of the region. Formation density data obtained by wireline logging were validated using laboratory-based bulk density data obtained by Archimedes method on diamond drill core samples at Geoscience Australia. Results of the validation show that wireline-logged formation density data and Archimedes wet bulk density data are in good general agreement in the first five boreholes drilled (NDIBK01, NDIBK02, NDIBK03, NDIBK04 and NDIBK05). Difficult drilling and some lost drilling equipment meant that boreholes NDIBK06, NDIBK07 and NDIBK09 could not be cased properly, or could not be re-entered, and thus formation density wireline logs could not be obtained in these holes. Boreholes NDIBK08 and NDIBK10 were wireline logged, however formation density results from these last two holes were problematic. Wireline formation density results for borehole NDIBK08 are shown to be too high due to miscalibration of the wireline formation density tool, and results from borehole NDIBK10 cannot be robustly assessed because of a lack of sufficient Archimedes bulk density data needed to provide statistical relevance and validate the wireline formation density data.
-
Geoscience Australia’s Exploring for the Future program provides precompetitive information to inform decision-making by government, community and industry on the sustainable development of Australia's mineral, energy and groundwater resources. By gathering, analysing and interpreting new and existing precompetitive geoscience data and knowledge, we are building a national picture of Australia’s geology and resource potential. The Paleo to Mesoproterozoic Birrindudu Basin is an underexplored frontier basin located in northwestern Northern Territory and northeastern Western Australia. The Birrindudu Basin is a region of focus for the second phase of the EFTF program (2020–2024) as it contains strata of similar age to the prospective McArthur Basin, South Nicholson region and Mount Isa Province, but remains comparatively poorly understood. Geoscience Australia (in collaboration with the Northern Territory Geological Survey) acquired around 700 line-kms of deep crustal reflection seismic data across northwest Northern Territory encompassing not only the frontier Birrindudu Basin but adjacent highly prospective regions, such as the Tanami. This ecat record releases the final survey route shapefiles, noting that some segments were not acquired due to site access restrictions. Seismic field data will be published in the near future release following completion of in-house QA/QC protocols
-
Geoscience Australia commissioned reprocessing of selected legacy 2D seismic data in the East Kimberley, onshore Bonaparte Basin as part of the Exploring for the Future (EFTF) program. Reprocessing of these data occurred between September 2017 and May 2018. Exploring for the Future (<a href="https://www.ga.gov.au/eftf/">https://www.ga.gov.au/eftf</a>) was a $100.5 million four-year (2016-20), Australian Government-funded program to provide a holistic picture of the potential mineral, energy and groundwater resources in northern Australia. The program has delivered new geoscience data, knowledge and decision support tools to support increased industry investment and sustainable economic development across the north. Groundwater is a critical resource that accounts for most water used across northern Australia. The groundwater component of the EFTF program focused on addressing groundwater resource knowledge gaps, to support future opportunities for economic development via irrigated agriculture, extractive industries and increased security of community water supplies. Through collaboration with State and Territory partners, the program undertook targeted regional investigations of groundwater systems and assessments of groundwater potential more broadly across the region. The program's activities, implemented by Geoscience Australia, involved application of innovative geoscience tools to collect, integrate and analyse a range of data. It includes geological and hydrogeological data, airborne and ground-based geophysical and hydrogeochemical surveys, remote sensing data as well as stratigraphic drilling. The new data and better understanding of groundwater systems also helps inform decision making about groundwater use to protect environmental and cultural assets. These outcomes strengthen investor confidence in resources and agricultural projects by de-risking groundwater in northern Australia. The package contains reprocessed data from ten surveys acquired between 1980 and 1997. In total 53 lines were reprocessed covering a fold area of approximately 618.9 line kilometres, with the objective to produce a modern industry standard 2D land seismic reflection dataset where possible from a selection of multiple legacy 2D data. The purpose of the reprocessing was twofold: 1) To image the near surface structural and stratigraphic configuration for linking to AEM data that is available in the Bonaparte Basin; and 2) To image the structure and stratigraphic architecture of the Paleozoic Bonaparte Basin. The dataset exhibits significant improvements in stack response in most of the reprocessed lines when final and legacy stacks were compared, especially in the shallow section. Optimum results were obtained from the noise attenuation workflows. A minimum processing flow was applied to BWA80, BWA81, and line BNT87-404 lines to avoid any signal leakage throughout the processing. Final data were delivered as minimum phase (care should be taken not to interpret zero crossings as geological boundaries), and final velocities produced a good match with the well checkshot velocities. The processing report from Down Under Geophysics is available for download with this release. Raw and processed data are available on request from <a href="mailto:clientservices@ga.gov.au&body=Ref: eCat 135578">clientservices@ga.gov.au</a> - Quote eCat# 135578. Processed stack SEG-Y files and ancillary data are available for download from this web page.
-
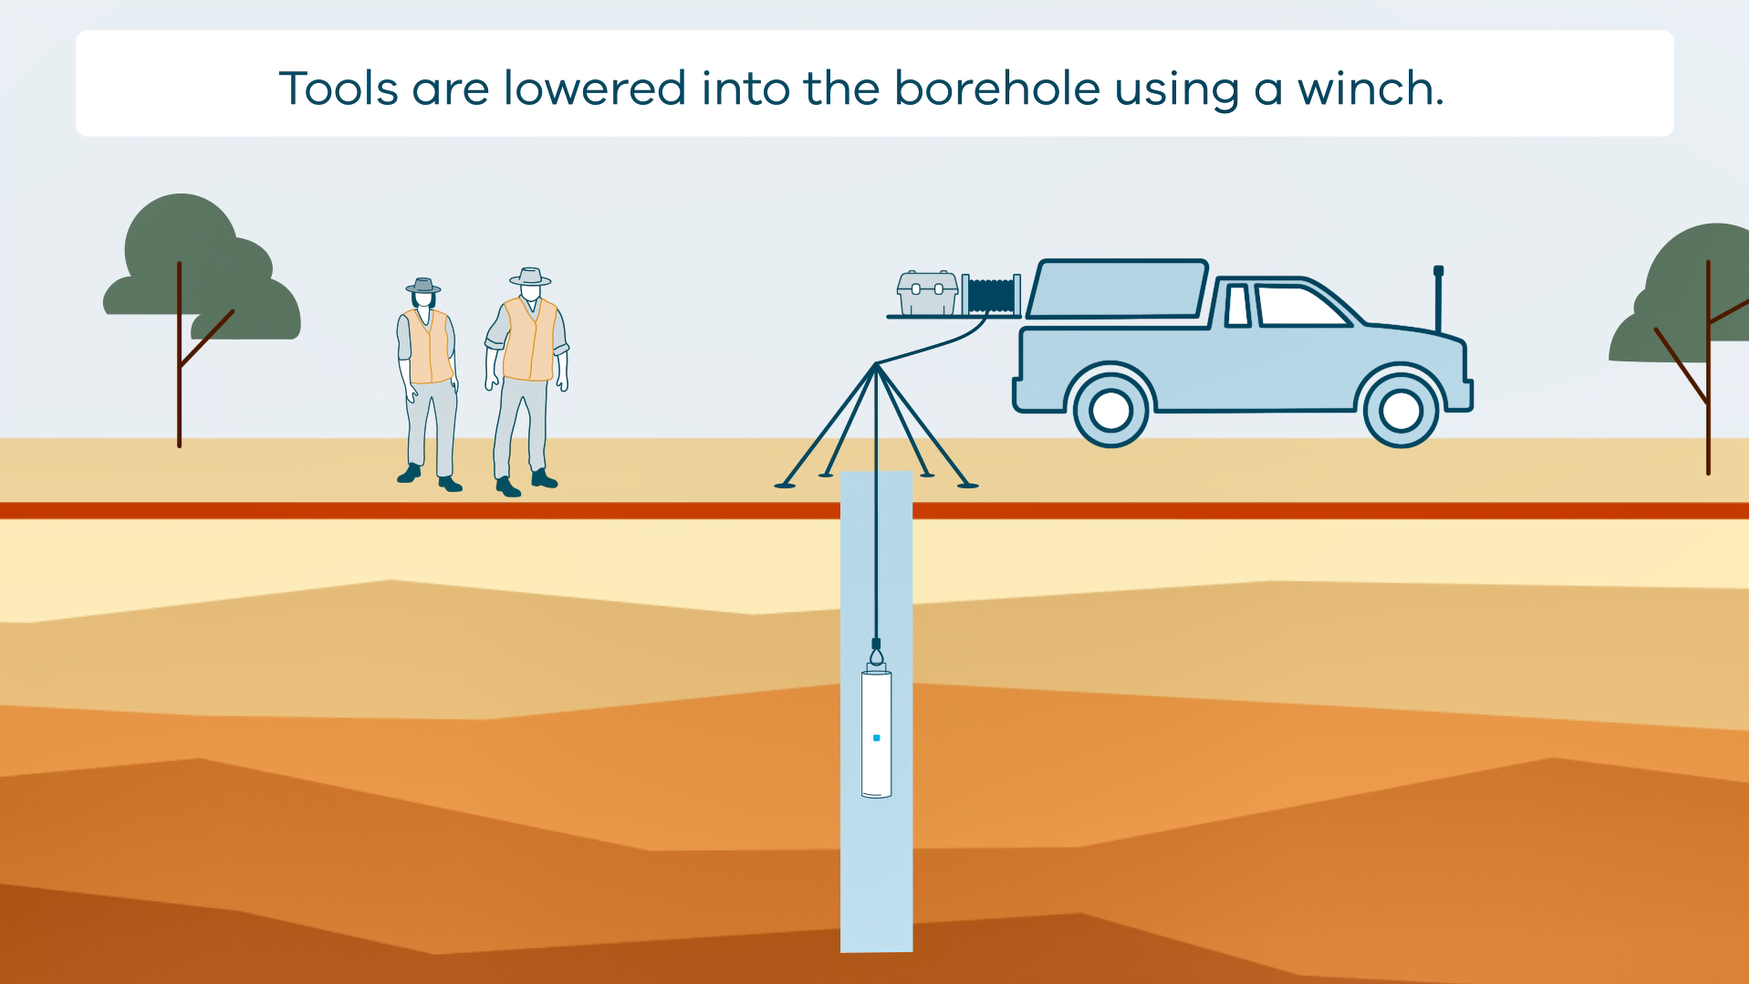
This animation shows how borehole geophysical surveys are conducted. It is part of a series of Field Activity Technique Engagement Animations. The target audience are the communities that are impacted by GA's data acquisition activities. There is no sound or voice over. The 2D animation includes a simplified view of what borehole geophysics equipment looks like, what the equipment measures and how scientists use the data.