AusAEM
Type of resources
Keywords
Publication year
Topics
-
<p>Geoscience Australia commissioned the AusAEM Year 1 NT/QLD survey as part of the Exploring for the Future (EFTF) program, flown over parts of the Northern Territory and Queensland. The EFTF program is led by Geoscience Australia (GA), in collaboration with the Geological Surveys of the Northern Territory, Queensland, South Australia and Western Australia. The program was designed to investigate the potential mineral, energy and groundwater resources in northern Australia and South Australia. <p>The survey was flown during the 2017-2018 field season, using the TEMPEST® airborne electromagnetic (AEM) system operated by CGG Aviation (Australia) Pty. Ltd under contract to Geoscience Australia. AusAEM Year 1 was acquired with a 20-kilometre line separation and collected over 60,000 line kilometres of data in total. The AusAEM Year 1 NT/QLD survey also includes over 1,500 line kilometres of infill flying, which, was funded by private exploration companies in certain infill blocks within the survey area. The data from these infill blocks are now part of Geoscience Australia release to the public domain, for use in the minerals, energy and groundwater sectors. <p> Previously Released data (Phase 1) <p>In December 2018, we released a package, which contains data from the AusAEM Year 1 NT/QLD Airborne Electromagnetic Survey Phase 1. <p>This data package, with eCat ID 124092 titled “AusAEM Year 1 NT/QLD Airborne Electromagnetic Survey, TEMPEST® airborne electromagnetic data and Em Flow® conductivity estimates”. The package contains a) survey logistics and processing report, b) final processed electromagnetic, magnetic and elevation point located line data, c) processed electromagnetic, magnetic and elevation grids, d) point located conductivity estimates from EM Flow®, e) multi-plots of line data and conductivity sections, all produced by the contractor CGG Aviation (Australia) Pty. These products are downloadable from Geoscience Australia’s website: (See http://www.ga.gov.au/metadata-gateway/metadata/record/gcat_124092). <p>The data provides new insights into vast areas in Northern Australia that have not been extensively explored previously. <p>Current Release (Phase 2) <p>This Phase 2 data release package contains results from inverting the electromagnetic data in the Phase 1 release. The inversion results were generated using Geoscience Australia's sample-by-sample layered-earth (1D) inversion, a deterministic regularized gradient-based algorithm, which we call GALEISBS (Brodie, 2016). <p>For the inversion of TEMPEST AEM data we have conventionally inverted the total (primary plus secondary) measured X-and Z-component data simultaneously to produce a single smooth layered conductivity model. To achieve convergence and derive an acceptable model and acceptable data misfits, we have found that it is necessary to solve for three geometry parameters; (1) Transmitter (Tx) –Receiver (Rx) horizontal in-line and 2) vertical separations and 3) the receiver pitch. This is the case even with the new Rx bird IMU measurements and calibrated data (Ley-Cooper et.al, 2019.). <p>We have extended the GALEISBS functionality to allow inversion of the vector sum of the X- and Z-component data. The rationale of modifying the algorithm is to eliminate the need to solve for Rx pitch, since the vector sum of the X- and Z-component data are insensitive to the Rx pitch. In doing this, we are gaining some robustness by not having to solve for one of the geometry parameters; however, the trade-off is that we are in essence losing the information implicit in the vector component data. <p>The inversions we deliver here we derived from a recently implemented XZ–vector-sum inversion, described in Ley-Cooper et.al, 2019. <p>The GALEISBS inversion products are available for download in parts based on the type of derived product. These are zipped into the following three files: <p>1. galeisbs_vector_sum_point_located_data_ascii.zip <p>2. galeisbs_vector_sum_point_located_data_geosoft.zip <p>3. galeisbs_vector_sum_sctions.zip <p>4. galeisbs_vector_sum_gocad_sgrids.zip
-
<div><strong>Yathong, Forbes, Dubbo, and Coonabarabran Airborne Electromagnetic Survey Blocks.</strong></div><div><br></div><div>Geoscience Australia (GA), in collaboration with the Geological Survey of New South Wales (GNSW), conducted an airborne electromagnetic (AEM) survey from April to June 2023. The survey spanned from the north-eastern end of the Yathong-Ivanhoe Trough and extended across the Forbes, Dubbo, and Coonabarabran regions of New South Wales. A total of 15, 090-line kilometres of new AEM and magnetic geophysical data were acquired. This survey was entirely funded by GSNSW and GA managed acquisition, quality control, processing, modelling, and inversion of the AEM data.</div><div><br></div><div>The survey was flown by Xcalibur Aviation (Australia) Pty Ltd using a 6.25 Hz HELITEM® AEM system. The survey blocks were flown at 2500-metre nominal line spacings, with variations down to 100 metres in the Coonabarabran block. It was flown following East-West line directions. Xcalibur also processed the acquired data. This data package includes the acquisition and processing report, the final processed AEM data, and the results of the contractor's conductivity-depth estimates. The data package also contains the results and derived products from a 1D inversion by Geoscience Australia with its own inversion software.</div><div><br></div><div>The survey will be incorporated and become part of the national AusAEM airborne electromagnetic acquisition program, which aims to provide geophysical information to support investigations of the regional geology and groundwater.</div><div><br></div><div><strong>The data release package contains:</strong></div><div><br></div><div>1. A data release package <strong>summary PDF document</strong></div><div>2. The <strong>survey logistics and processing report</strong> and HELITEM® system specification files</div><div>3. <strong>Final processed point located line data</strong> in ASEG-GDF2 format for the five areas</div><div> -final processed dB/dt electromagnetic, magnetic and elevation data</div><div> -final processed B field electromagnetic, magnetic and elevation data</div><div><strong> <em>Conductivity estimates generated by Xcalibur’s inversion </em></strong></div><div> -point located conductivity-depth line data output from the inversion in ASEG-GDF2 format</div><div> -graphical (PDF) multiplot conductivity stacks and section profiles for each flight line</div><div> -graphical (PNG) conductivity sections for each line</div><div> -grids generated from the Xcalibur’s inversion in ER Mapper® format (layer conductivities slices, DTM, X & Z component for each of the 25 channels, time constants, TMI)</div><div>4.<strong> ESRI shape and KML</strong> (Google Earth) files for the flight lines and boundary</div><div>5<strong>. Conductivity estimates generated by Geoscience Australia's inversion </strong></div><div> -point located line data output from the inversion in ASEG-GDF2 format</div><div> -graphical (pdf) multiplot conductivity sections for each line</div><div> -georeferenced (PNG) conductivity sections (suitable for pseudo-3D display in a 2D GIS)</div><div> -GoCAD™ S-Grid 3D objects (suitable for various 3D packages)</div><div> -Curtain image conductivity sections in log & liner colour stretch (suitable 3D display in GA’s EarthSci)</div><div><br></div><div><strong>Directory structure</strong></div><div>├── <strong>01_Report</strong></div><div>├── <strong>02_XCalibur_delivered</strong></div><div>│ ├── * survey_block_Name</div><div>│ ├── cdi</div><div>│ │ ├── sections</div><div>│ │ └── stacks</div><div>│ ├── grids</div><div>│ │ ├── cnd</div><div>│ │ ├── dtm</div><div>│ │ ├── emxbf</div><div>│ │ ├── emxdb</div><div>│ │ ├── emxff</div><div>│ │ ├── emxzbf</div><div>│ │ ├── emzdb</div><div>│ │ ├── time_constant</div><div>│ │ └── tmi</div><div>│ ├── located_data</div><div>│ ├── maps</div><div>│ └── waveform</div><div>│ </div><div>├── <strong>03_Shape&kml</strong></div><div>└── <strong>04_GA_Layer_Earth_inversion</strong></div><div> ├── * survey_block_Name</div><div> ├── GA_georef_sections</div><div> │ ├── linear-stretch</div><div> │ └── log-stretch</div><div> ├── GA_Inverted_conductivity_models</div><div> ├── GA_multiplots</div><div> └── GA_sgrids</div><div> </div> <b>Final Processed point located line data is available on request from clientservices@ga.gov.au - Quote eCat# 149118</b>
-
The Exploring for the Future program Showcase 2024 was held on 13-16 August 2024. Day 2 - 14th August talks included: <b>Session 1 - Architecture of the Australian Tectonic Plate</b> <a href="https://youtu.be/a8jzTdNdwfk?si=OWNlVR-FLDhF1GVM">AusArray: Australian lithosphere imaging from top to bottom</a> - Dr Alexei Gorbatov <a href="https://youtu.be/j5ox8Ke5n6M?si=YkfDno2xmZXueS1b">AusLAMP: Mapping lithospheric architecture and reducing exploration space in Australia</a> - Jingming Duan <a href="https://youtu.be/qZ6wjzx_dNc?si=NjDEzvqyEeM24-E8">Constraining the thermomechanical and geochemical architecture of the Australian mantle: Using combined analyses of xenolith inventories and seismic tomography</a> - Dr Mark Hoggard <b>Session 2 - Quantitative characterisation of Australia's surface and near surface</b> <a href="https://youtu.be/nPfa_j3_dos?si=mktfIJWXeLElIOK4">AusAEM: The national coverage and sharpening near surface imaging</a> - Dr Anandaroop Ray <a href="https://youtu.be/SU6ak98JvAw?si=DQPovulHa4poqcm0">Unlocking the surface geochemistry of Australia</a> - Phil Main <a href="https://youtu.be/Xtm45CT6e-s?si=JHU7J-ktgVrbj1Ke">Spotlight on the Heavy Mineral Map of Australia</a> - Dr Alex Walker <b>Session 3 – Maps of Australian geology like never before</b> <a href="https://youtu.be/aRISb1YYigU?si=3byJbqW0qRTqCB8-">An Isotopic Atlas of Australia: Extra dimensions to national maps</a> - Dr Geoff Fraser <a href="https://youtu.be/khSy-WAkw-w?si=F-Y67FX3jXN5zZaz">First continental layered geological map of Australia</a> - Dr Guillaume Sanchez <a href="https://youtu.be/Z3GlCJepLK4?si=k_tbaKdmxGBmoSro">An integrated 3D layered cover modelling approach: Towards open-source data and methodologies for national-scale cover modelling</a> - Sebastian Wong View or download the <a href="https://dx.doi.org/10.26186/149800">Exploring for the Future - An overview of Australia’s transformational geoscience program</a> publication. View or download the <a href="https://dx.doi.org/10.26186/149743">Exploring for the Future - Australia's transformational geoscience program</a> publication. You can access full session and Q&A recordings from YouTube here: 2024 Showcase Day 2 - Session 1 - <a href="https://www.youtube.com/watch?v=EHBsq0-pC8c">Architecture of the Australian Tectonic Plate</a> 2024 Showcase Day 2 - Session 2 - <a href="https://youtube.com/watch?v=xih4lbDk-1A">Quantitative characterisation of Australia's surface and near surface</a> 2024 Showcase Day 2 - Session 3 - <a href="https://www.youtube.com/watch?v=qeTLc1K-Cds">Maps of Australian geology like never before</a>
-
<div><strong>Output Type: </strong>Exploring for the Future Extended Abstract</div><div><br></div><div><strong>Short Abstract:</strong> Under the Exploring for the Future (EFTF) program, Geoscience Australia staff and collaborators engaged with land-connected stakeholders that managed or had an interest in land comprising 56% of the total land mass area of Australia. From 2020 to 2023, staff planning ground-based and airborne geophysical and geological data acquisition projects consulted farmers, National Park rangers and managers, Native Title holders, cultural heritage custodians and other land-connected people to obtain land access and cultural heritage clearances for surveys proposed on over 122,000 parcels of land. Engagement did not always result in field activities proceeding. To support communication with this diverse audience, animations, comic-style factsheets, and physical models, were created to help explain field techniques. While the tools created have been useful, the most effective method of communication was found to be a combination of these tools and open two-way discussions.</div><div><br></div><div><strong>Citation: </strong>Sweeney, M., Kuoni, J., Iffland, D. & Soroka, L., 2024. Improving how we engage with land-connected people about geoscience. In: Czarnota, K. (ed.) Exploring for the Future: Extended Abstracts. Geoscience Australia, Canberra. https://doi.org/10.26186/148760</div>
-
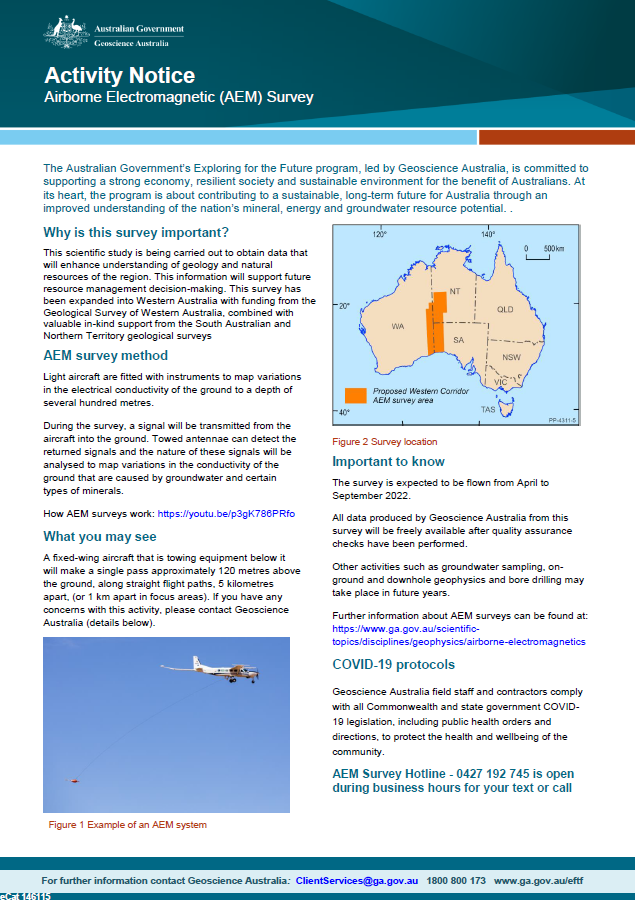
Geoscience Australia, in collaboration with state governments, will be carrying out airborne electromagnetic (AEM) surveys in western South Australia, southern NT and eastern WA during 2022. This scientific research is being carried out to obtain data that will enhance understanding of geology and natural resources of the region. This information will support future resource management decision-making. This survey has been expanded into Western Australia with funding from the Geological Survey of Western Australia, combined with valuable in-kind support from the South Australian and Northern Territory geological surveys. <p>
-
<div>A national compilation of airborne electromagnetic (AEM) conductivity–depth models from AusAEM (Ley-Cooper et al. 2020) survey line data and other surveys (see reference list in the attachments) has been used to train a conductivity model prediction for the 0-4 m and 30 m depth intervals. Over 460,000 training points/measurements were used in a 5 K-Fold training and validation split. A further 28,626 points/measurements were used to assess the out of sample performance (OOS; i.e. points not used in the model validation). Modelling of the conductivity values (i.e. measurements along the AEM survey lines) was performed using the gradient boosted (GB) tree algorithm. The GB model is a machine learning (ML) ensemble technique used for both regression and classification tasks (https://scikit-learn.org/stable/modules/generated/sklearn.ensemble.GradientBoostingRegressor.html). Samples along the flight-line were thinned to approximately one sample per 300 m. This avoided the situation where we could have more than one sample per pixel (i.e. features or covariates used in the model prediction have a cell or pixel size of 80 m) that could otherwise lead to over fitting. In addition, out of sample set used label clusters or groups to minimise overfitting. Here we use the median of the models as the conductivity prediction and the upper and lower percentiles (95th and 5th respectively) to measure the model uncertainty. Grids show conductivity (S/m) in log 10 units. The methodology used to generate these conductivity grids are overall similar to that described by Wilford, et al. 2022.</div><div> </div><div>Reported out-of-sample r-squares for the 0-4 m and 3 m depths are 0.76 and 0.74, respectively. The ML approach allows estimation of conductivity into areas where we do not have airborne electromagnetic survey coverage. Hence these model have a national extent. Where we do not have AEM survey coverage the model is finding relationships with the covariates and making informed estimates of conductivity in those areas. Where those relationships are not well understood (i.e. where we see a departure in the feature space characteristics from what the model can ‘see’) the model prediction is likely to be less certain. Differences in the features and their corresponding values ‘seen’ and used in the model versus the full feature space covering the entire continent are captured in the covariate shift map. High values in the shift model can indicate higher potential uncertainty or unreliability of the model prediction. Users therefore need to be mindful when interpreting this dataset, of the uncertainties shown by the 5th-95th percentiles, and high values in the covariate shift map.</div><div> </div><div>Datasets in this data package include:</div><div> </div><div>1. 0_4m_conductivity_prediction_median.tif</div><div>2. 0_4m_conductivity_lower_percentile_5th.tif</div><div>3. 0_4m_conductivity_upper_percentile_95th.tif</div><div>4. 30m_conductivity_prediction_median.tif</div><div>5.30m_conductivity_lower_percentile_5th.tif</div><div>6. 30m_conductivity_upper_percentile_95th.tif</div><div>7. National_conductivity_model_shift.tif</div><div>8. Full list of referenced AEM survey datasets used to train the model (word document)</div><div>9. Map showing the distribution of training and out-of-sample sites</div><div><br></div><div>All the Geotiffs (1-6) are in log (10) electrical conductivity siemens per metre (S/m).</div><div> </div><div>This work is part of Geoscience Australia’s Exploring for the Future program which provides precompetitive information to inform decision-making by government, community and industry on the sustainable development of Australia's mineral, energy and groundwater resources. By gathering, analysing and interpreting new and existing precompetitive geoscience data and knowledge, we are building a national picture of Australia’s geology and resource potential. This leads to a strong economy, resilient society and sustainable environment for the benefit of all Australians. This includes supporting Australia’s transition to net zero emissions, strong, sustainable resources and agriculture sectors, and economic opportunities and social benefits for Australia’s regional and remote communities. The Exploring for the Future program, which commenced in 2016, is an eight year, $225m investment by the Australian Government.</div><div><br></div><div><br></div><div><strong>Reference:</strong></div><div><br></div><div>Ley-Cooper, A. Y., Brodie, R.C., and Richardson, M. 2020. AusAEM: Australia’s airborne electromagnetic continental-scale acquisition program, Exploration Geophysics, 51:1, 193-202, DOI: 10.1080/08123985.2019.1694393</div><div><br></div><div>Wilford, J., LeyCooper, Y., Basak, S., Czarnota, K. 2022. High resolution conductivity mapping using regional AEM survey and machine learning. Geoscience Australia, Canberra. https://dx.doi.org/10.26186/146380</div>
-
This animation shows how Airborne Electromagnetic Surveys Work, when conducted by a rotary wing (helicopter) aircraft. It is part of a series of Field Activity Technique Engagement Animations. The target audience are the communities that are impacted by our data acquisition activities. There is no sound or voice over. The 2D animation includes a simplified view of what AEM equipment looks like, what the equipment measures and how the survey works.
-
This animation shows how Airborne Electromagnetic Surveys Work. It is part of a series of Field Activity Technique Engagement Animations. The target audience are the communities that are impacted by our data acquisition activities. There is no sound or voice over. The 2D animations include a simplified view of what AEM equipment looks like, what the equipment measures and how the survey works.
-
<div>The interpretation of AusAEM airborne electromagnetic (AEM) survey conductivity sections in the Canning Basin region delineates the geo-electrical features that correspond to major chronostratigraphic boundaries, and captures detailed stratigraphic information associated with these boundaries. This interpretation forms part of an assessment of the underground hydrogen storage potential of salt features in the Canning Basin region based on integration and interpretation of AEM and other geological and geophysical datasets. A main aim of this work was to interpret the AEM to develop a regional understanding of the near-surface stratigraphy and structural geology. This regional geological framework was complimented by the identification and assessment of possible near-surface salt-related structures, as underground salt bodies have been identified as potential underground hydrogen storage sites. This study interpreted over 20,000 line kilometres of 20 km nominally line-spaced AusAEM conductivity sections, covering an area approximately 450,000 km2 to a depth of approximately 500 m in northwest Western Australia. These conductivity sections were integrated and interpreted with other geological and geophysical datasets, such as boreholes, potential fields, surface and basement geology maps, and seismic interpretations. This interpretation produced approximately 110,000 depth estimate points or 4,000 3D line segments, each attributed with high-quality geometric, stratigraphic, and ancillary data. The depth estimate points are formatted for Geoscience Australia’s Estimates of Geological and Geophysical Surfaces database, the national repository for formatted depth estimate points. Despite these interpretations being collected to support exploration of salt features for hydrogen storage, they are also intended for use in a wide range of other disciplines, such as mineral, energy and groundwater resource exploration, environmental management, subsurface mapping, tectonic evolution studies, and cover thickness, prospectivity, and economic modelling. Therefore, these interpretations will benefit government, industry and academia interested in the geology of the Canning Basin region.</div>
-
<div>This data package contains interpretations of airborne electromagnetic (AEM) conductivity sections in the Exploring for the Future (EFTF) program’s Eastern Resources Corridor (ERC) study area, in south eastern Australia. Conductivity sections from 3 AEM surveys were interpreted to provide a continuous interpretation across the study area – the EFTF AusAEM ERC (Ley-Cooper, 2021), the Frome Embayment TEMPEST (Costelloe et al., 2012) and the MinEx CRC Mundi (Brodie, 2021) AEM surveys. Selected lines from the Frome Embayment TEMPEST and MinEx CRC Mundi surveys were chosen for interpretation to align with the 20 km line-spaced EFTF AusAEM ERC survey (Figure 1).</div><div>The aim of this study was to interpret the AEM conductivity sections to develop a regional understanding of the near-surface stratigraphy and structural architecture. To ensure that the interpretations took into account the local geological features, the AEM conductivity sections were integrated and interpreted with other geological and geophysical datasets, such as boreholes, potential fields, surface and basement geology maps, and seismic interpretations. This approach provides a near-surface fundamental regional geological framework to support more detailed investigations. </div><div>This study interpreted between the ground surface and 500 m depth along almost 30,000 line kilometres of nominally 20 km line-spaced AEM conductivity sections, across an area of approximately 550,000 km2. These interpretations delineate the geo-electrical features that correspond to major chronostratigraphic boundaries, and capture detailed stratigraphic information associated with these boundaries. These interpretations produced approximately 170,000 depth estimate points or approximately 9,100 3D line segments, each attributed with high-quality geometric, stratigraphic, and ancillary data. The depth estimate points are formatted for compliance with Geoscience Australia’s (GA) Estimates of Geological and Geophysical Surfaces (EGGS) database, the national repository for standardised depth estimate points. </div><div>Results from these interpretations provided support to stratigraphic drillhole targeting, as part of the Delamerian Margins NSW National Drilling Initiative campaign, a collaboration between GA’s EFTF program, the MinEx CRC National Drilling Initiative and the Geological Survey of New South Wales. The interpretations have applications in a wide range of disciplines, such as mineral, energy and groundwater resource exploration, environmental management, subsurface mapping, tectonic evolution studies, and cover thickness, prospectivity, and economic modelling. It is anticipated that these interpretations will benefit government, industry and academia with interest in the geology of the ERC region.</div>