flood
Type of resources
Keywords
Publication year
Topics
-
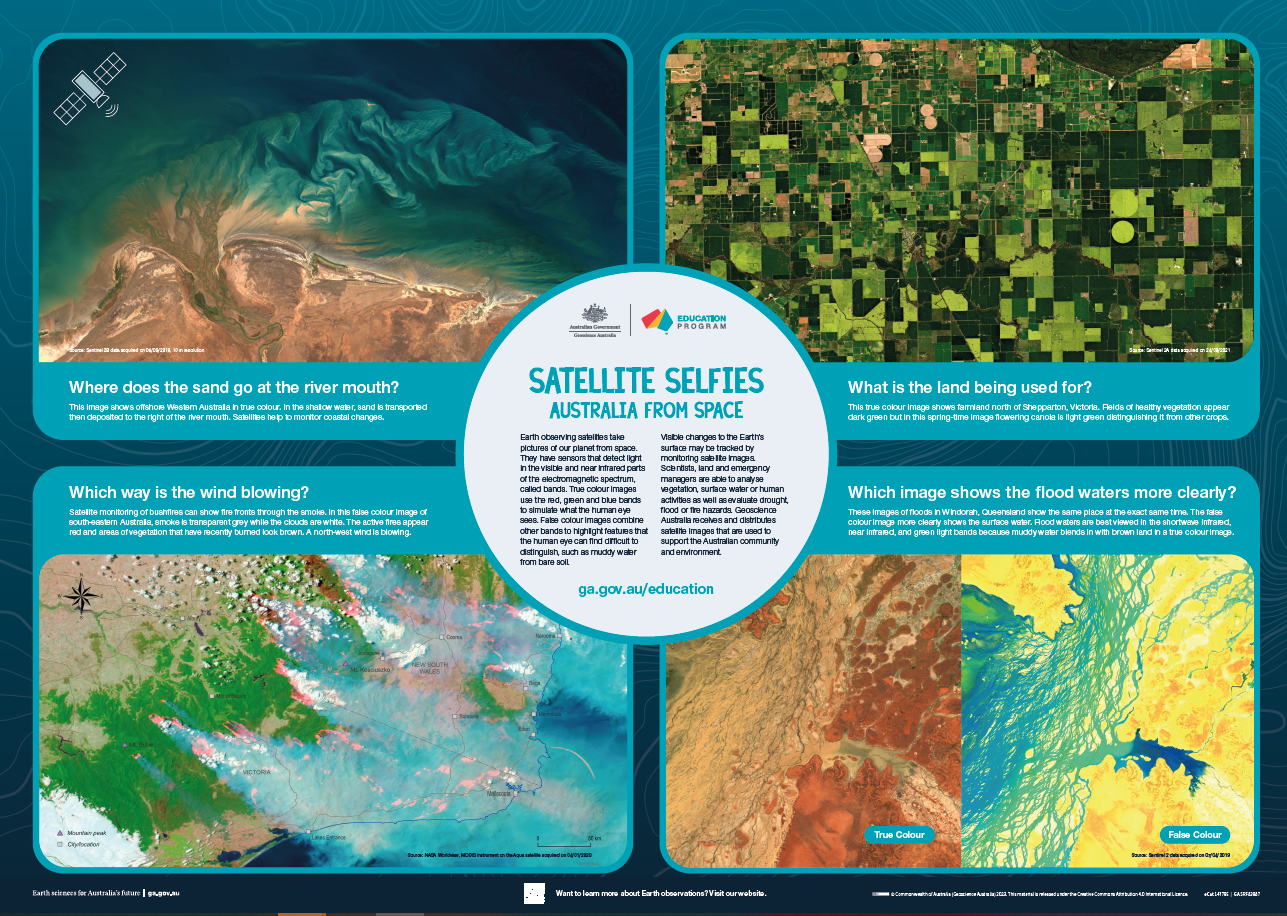
<div>The A1 poster incorporates 4 images of Australia taken from space by Earth observing satellites. The accompanying text briefly introduces sensors and the bands within the electromagnetic spectrum. The images include examples of both true and false colour and the diverse range of applications of satellite images such as tracking visible changes to the Earth’s surface like crop growth, bushfires, coastal changes and floods. Scientists, land and emergency managers use satellite images to analyse vegetation, surface water or human activities as well as evaluate natural hazards.</div>
-
User Manual - Australian Flood Studies Database Search
-
This talk presents an overview of flood vulnerability research in the Community Safety Branch at Geoscience Australia. It covers work looking at the tangible and intangible costs of floods. Vulnerability models for residential, commercial and industrial buildings are described. The cost-effectiveness of structural mitigation options have been evaluated in recent work undertaken in collaboration with Bushfire and Natural Hazards CRC. The presentation highlights the utility of this research in reducing flood risk in Australian communities.
-
Geoscience Australia, the Western Australian Department of Planning and the Western Australian Planning Commission have collaborated through this study to develop a regional-scale inundation model capable of simulating combined storm tide and riverine flood scenarios within current and future climate conditions (sea-level rise influences only). Modelling scenarios were applied to the Busselton region of Western Australia.
-
The aim of this document is to * outline the information management process for inundation modelling projects using ANUGA * outline the general process adopted by Geoscience Australia in modelling inundation using ANUGA * allow a future user to understand (a) how the input and output data has been stored (b) how the input data has been checked and/or manipulated before use (c) how the model has been checked for appropriateness
-
Replaced by 78873 Record 2014/003 (A Marshall 29/01/14)
-
The satellite images below show the dramatic effect on the land of recent heavy rain, causing floodwaters to inundate south-west Queensland. This area is known as the Channel Country and has an extensive braided river system which includes the Georgina River, the Diamantina River and Cooper Creek. Excess water from this area generally feeds into the Lake Eyre system which is a vast drainage basin in Australia's arid interior. Flooding of the magnitude visible on the satellite images can cause Lake Eyre to fill up - something which occurs very rarely.
-
The response to emergency situations such as floods and fires demand products in short time frames. If you use remote sensing then the response typically involves detailed examination of imagery in order to determine the spectral bands, ratios and associated thresholds that map the desired features such as flood or burn extent. The trial and error process associated with manual threshold selection is often time consuming and can result in significant errors due to confounding factors such as clouds and shadowed areas. By modelling features such as flood waters or fire scars as Gaussian distributions, allowing for fuzzy thresholds with neighbouring features, the required thresholds can be automatically derived from the imagery and emergency events can have extents determined much more rapidly. Automatic threshold selection minimises trial and error, thereby dramatically reducing processing turn-around time.
-
The flood risk in many urban catchments is poorly understood. Legacy stormwater infrastructure is often substandard and anticipated climate change induced sea level rise and increased rainfall intensity will typically exacerbate present risk. In a Department of Climate Change and Energy Efficiency (DCCEE) funded collaboration between Geoscience Australia (GA) and the City of Sydney (CoS), the impacts on the Alexandra Canal catchment have been studied. This work has built upon detailed flood hazard analyses by Cardno commissioned by the CoS and has entailed the development of exposure and vulnerability information. Significantly, the case study has highlighted the value of robust exposure attributes and vulnerability models in the development of flood risk knowledge. The paper describes how vulnerability knowledge developed following the 2011 Brisbane floods to include key building types found in the inner suburb of Sydney. It also describes the systematic field capture of building exposure information in the catchment area and its categorisation into 19 generic building types. The assessment of ground floor heights using the Field Data Analysis Tool (FiDAT) developed at Geoscience Australia is also presented. The selected hazard scenario was a 100 year ARI event with 20% increased rainfall intensity accompanied by a 0.55m sea level rise in Botany Bay. The impact from the selected scenario was assessed in terms of monetary loss for four combinations of vulnerability model suite (GA and NSW Government) and floor height attribution method (assumed 0.15m uniformly and evaluated from LiDAR and street view imagery). It was observed that the total loss is higher in the case of assumed floor heights compared to FiDAT processed floor heights as the former failed to capture increased floor heights for newer construction. However, the loss is lower when only two vulnerability models developed by NSW Government are applied for the entire building stock in the region as two models could not reliably represent the whole building stock.
-
The datasets created to produce the emergency mapping support products which contributed to fulfilling GA's arrangements in supporting the outcomes sought by the Australian Government during disaster events.

