Geomorphology
Type of resources
Keywords
Publication year
Service types
Topics
-
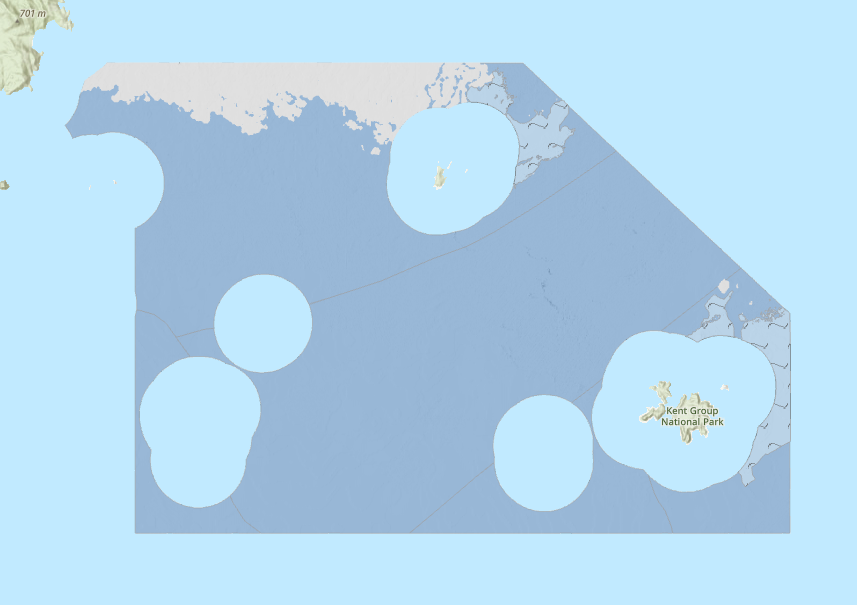
This OGC Web Map Service (WMS) contains seabed morphology and geomorphology information for a subset area of Zeehan Marine Park (South-east Marine Parks Network) and is intended for use by marine park managers, regulators and other stakeholders. This web service uses the data product published in McNeil et al. (2023); eCat Record 148620.
-
This OGC Web Feature Service (WFS) contains geospatial seabed morphology and geomorphology information for Flinders Reefs within the Coral Sea Marine Park and are intended for use by marine park managers, regulators, the general public and other stakeholders. This web service uses the data product published in McNeil et al. (2023); eCat Record 147998.
-
This ESRI map (web) service contains geospatial seabed morphology and geomorphology information for the Beagle Marine Park (South-east Marine Parks Network) and is intended for use by marine park managers, regulators and other stakeholders. This web service uses the data product published in Nanson et al. (2023); eCat Record 147976.
-
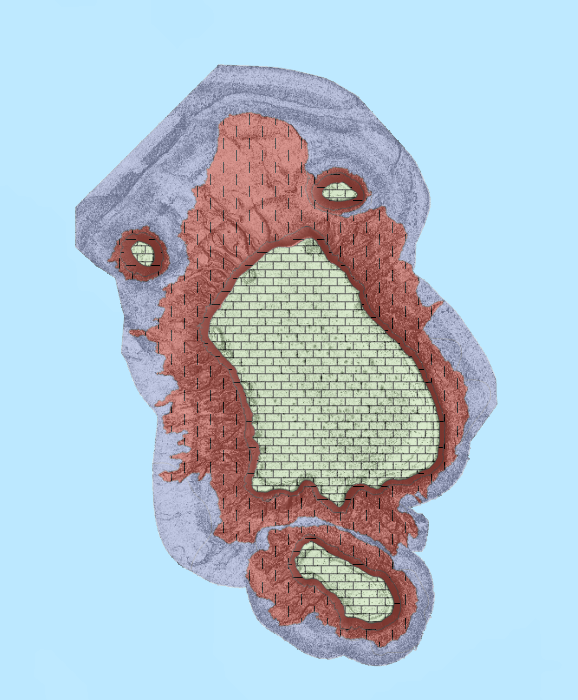
Here we present the surficial geology map for the Vestfold Hills, East Antarctica. On the coast of Prydz Bay, the region is one of the largest ice-free areas in Antarctica. Surficial geology mapping at 1:2000 was undertaken with field observations in the 2018/19 and 2019/20 summer seasons as well as aerial photography and satellite imagery interpretation. Units are based on the Geological Survey of Canada Surficial Data Model Version 2.4.0 (Deblonde et al 2019).
-
This ESRI map (web) service contains geospatial seabed morphology and geomorphology information for Flinders Reefs within the Coral Sea Marine Park and are intended for use by marine park managers, regulators, the general public and other stakeholders. This web service uses the data product published in McNeil et al. (2023); eCat Record 147998.
-
This OGC Web Map Service (WMS) contains geospatial seabed morphology and geomorphology information for Flinders Reefs within the Coral Sea Marine Park and are intended for use by marine park managers, regulators, the general public and other stakeholders. This web service uses the data product published in McNeil et al. (2023); eCat Record 147998.
-
Publicly available bathymetry and geophysical data has been used to map geomorphic features of the Antarctic continental margin and adjoining ocean basins at scales of 1:1-2 million. The key bathymetry datasets used were GEBCO08 and ETOPO2 satellite bathymetry (Smith & Sandwell 1997), in addition to seismic lines in key areas. Twenty-seven geomorphic units were identified based on interpretation of the seafloor bathymetry with polygons digitised by hand in ArcGIS. Seafloor features were classified largely based on the International Hydrographic Organisation (2001) classification of undersea features, and expanded to include additional features, including those likely to have specific substrate types and influence on oceanography. This approach improves the technique as a predictor of physical conditions that may influence seafloor communities. The geomorphic map has been used for developing a benthic bioregionalisation and for developing a representative system of Marine Protected Areas for East Antarctica. Slight modifications have been made since original publication in O'Brien et al. 2009 and Post et al. 2014. These include: - updating of some feature names; - combining "wave affected banks" with "shelf banks" - Combining "coastal terrance" with "island coastal terrane" as "Coastal/Shelf Terrane" - replacing canyon vectors with polygons by using a buffer around the vectors Further details of the original mapping can be found in: O'Brien, P.E., Post, A.L., Romeyn, R., 2009. Antarctic-wide geomorphology as an aid to habitat mapping and locating Vulnerable Marine Ecosystems, Commission for the Conservation of Antarctic Marine Living Resources Vulnerable Marine Ecosystems Workshop, Paper WS-VME-09/10. CCAMLR, La Jolla, California, USA. Post, A.L., Meijers, A.J.S., Fraser, A.D., Meiners, K.M., Ayers, J., Bindoff, N.L., Griffiths, H.J., Van de Putte, A.P., O'Brien, P.E., Swadling, K.M., Raymond, B., 2014. Chapter 14. Environmental Setting, In: De Broyer, C., Koubbi, P., Griffiths, H.J., Raymond, B., d'Udekem d'Acoz, C., et al. (Eds.), Biogeographic Atlas of the Southern Ocean. Scientific Committee on Antarctic Research, Cambridge, pp. 46-64.
-
This OGC Web Feature Service (WFS) contains geospatial seabed morphology and geomorphology information for the Beagle Marine Park (South-east Marine Parks Network) and is intended for use by marine park managers, regulators and other stakeholders. This web service uses the data product published in Nanson et al. (2023); eCat Record 147976.
-
Abstract: The extent to which fluids may leak from sedimentary basins to the seabed is a critical issue for assessing the potential of a basin for carbon capture and storage. The Petrel Sub-basin, located beneath central and eastern Joseph Bonaparte Gulf in tropical northern Australia, is identified as potentially suitable for the geological storage of CO2 because of its geological characteristics and proximity to offshore gas and petroleum resources. In May 2012, a multidisciplinary marine survey was undertaken to collect data in two targeted areas of the Petrel Sub-basin to facilitate an assessment of CO2 storage potential. Multibeam bathymetry and backscatter mapping (650 km2 over 5,300 line km), combined with acoustic sub-bottom profiling (650 line km) and geomorphological and sediment characterisation of the seabed was undertaken above the CO2 supercritical seal boundary of the sub-basin. Features identified in the high resolution (2 m) bathymetry data include carbonate banks, ridges, pockmark fields and fields of low amplitude hummocks located directly adjacent to banks. Unit and composite pockmarks and clusters of pockmarks are present on plains and adjacent to, and on, carbonate ridges. It is postulated that there are three possible sources for fluids and fluidised gas involved in pockmark formation: deep fluids from the basin, post-Cretaceous intra-formational, layer-bound fluids, and shallow-sourced fluidised gas from the breakdown of organic matter following the Holocene marine transgression of Joseph Bonaparte Gulf.
-
This report presents key results from hydrogeological investigations in the Tennant Creek region, completed as part of Exploring for the Future (EFTF)—an eight year, $225 million Australian Government funded geoscience data and information acquisition program focused on better understanding the potential mineral, energy and groundwater resources across Australia. The EFTF Southern Stuart Corridor (SSC) Project area is located in the Northern Territory and extends in a north–south corridor from Tennant Creek to Alice Springs, encompassing four water control districts and a number of remote communities. Water allocation planning and agricultural expansion in the SSC is limited by a paucity of data and information regarding the volume and extent of groundwater resources and groundwater systems more generally. Geoscience Australia, in partnership with the Northern Territory Department of Environment and Natural Resources and Power and Water Corporation, undertook an extensive program of hydrogeological investigations in the SSC Project area between 2017 and 2019. Data acquisition included; helicopter airborne electromagnetic (AEM) and magnetic data; water bore drilling; ground-based and downhole geophysical data for mapping water content and defining geological formations; hydrochemistry for characterising groundwater systems; and landscape assessment to identify potential managed aquifer recharge (MAR) targets. This report focuses on the Tennant Creek region—part of the Barkly region of the Northern Territory. Investigations in this region utilised existing geological and geophysical data and information, which were applied in the interpretation and integration of AEM and ground-based geophysical data, as well as existing and newly acquired groundwater hydrochemical and isotope data. The AEM and borehole lithological data reveal the highly weathered (decomposed) nature of the geology, which is reflected in the hydrochemistry. These data offer revised parameters, such as lower bulk electrical conductivity values and increased potential aquifer volumes, for improved modelling of local groundwater systems. In many instances the groundwater is shown to be young and of relatively good quality (salinity generally <1000 mg/L total dissolved solids), with evidence that parts of the system are rapidly recharged by large rainfall events. The exception to this is in the Wiso Basin to the west of Tennant Creek. Here lower quality groundwater occurs extensively in the upper 100 m below ground level, but this may sit above potentially potable groundwater and that possibility should be investigated further. Faults are demonstrated to have significantly influenced the occurrence and distribution of weathered rocks and of groundwater, with implications for groundwater storage and movement. Previously unrecognised faults in the existing borefield areas should be investigated for their potential role in compartmentalising groundwater. Additionally a previously unrecognised sub-basin proximal to Tennant Creek may have potential as a groundwater resource or a target for MAR. This study has improved understanding of the quantity and character of existing groundwater resources in the region and identified a managed aquifer recharge target and potential new groundwater resources. The outcomes of the study support informed water management decisions and improved water security for communities; providing a basis for future economic investment and protection of environmental and cultural values in the Tennant Creek and broader Barkly region. Data and information related to the project are summarised in the conclusions of this report and are accessible via the EFTF portal (https://portal.ga.gov.au/).