Educational Product
Type of resources
Keywords
Publication year
Scale
Topics
-
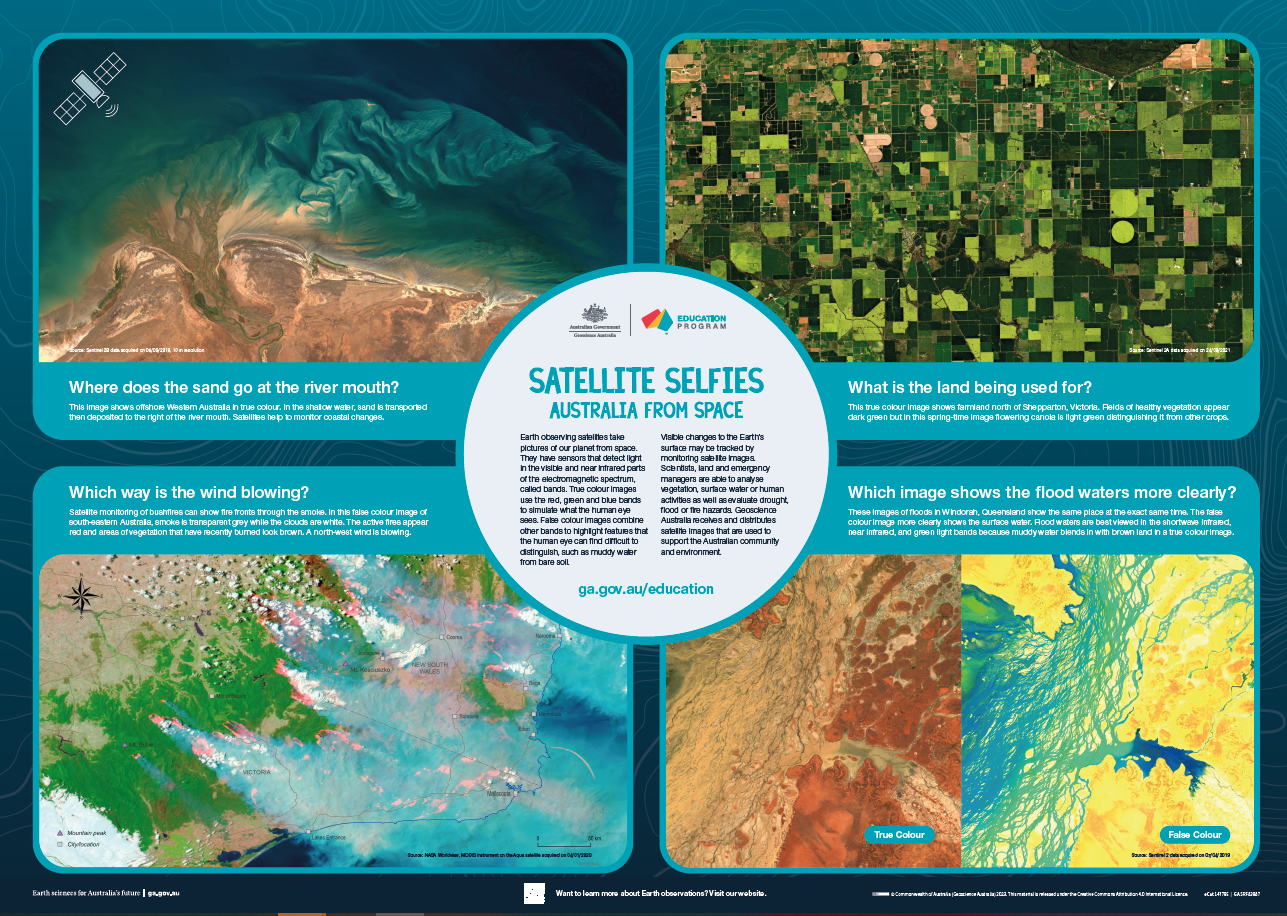
<div>The A1 poster incorporates 4 images of Australia taken from space by Earth observing satellites. The accompanying text briefly introduces sensors and the bands within the electromagnetic spectrum. The images include examples of both true and false colour and the diverse range of applications of satellite images such as tracking visible changes to the Earth’s surface like crop growth, bushfires, coastal changes and floods. Scientists, land and emergency managers use satellite images to analyse vegetation, surface water or human activities as well as evaluate natural hazards.</div>
-
Presentation for the National Science Week 2013, AMOS Seminar "The 2003 Canberra fires - 10 years after: What have we learned" 1-5pm CSIRO Discovery Centre 18 August 2013
-
Handout about the SHRIMP instrument for visitors to GA SHRIMP Lab.
-
Developed in consultation with Emergency Management Australia (EMA), this kit defines and maps major hazards affecting Australia - earthquakes, tsunamis, landslides, volcanoes, severe storms, cyclones, bushfires, floods and droughts. This kit helps students and teachers recognise risks from different natural hazards and the practical steps we can all take to reduce their effects. The Australian Natural Hazards Education Map Kit contains: - eight colour A3 poster maps with descriptive text - eight blackline A4 map masters - background information on each hazard - student activities - Emergency Management Australia hazard action cards Suitable for primary years 5-6 and secondary years 7-8.
-
This document contains a summary of and links to Geoscience Australia's resources appropriate for the teaching of Year 4, 6, 8 and 9 Earth and Space Science.
-
The Map Reading Guide provides an introduction to topographic maps that is suitable for anyone. This book is an ideal map reading manual for a wide range of map users. A map card, "roamer", is also included. <ul> <li>an explanation of what is a topographic map </li> <li>steps on how to read topographic maps, including explanations of map scale and how to use a map scale to calculate distance </li> <li>the differences between grid north, true north and magnetic north </li> <li>an explanation of symbols used on topographic map symbols</li> <li>how hills and mountains are shown on maps using relief shading, hypsometric tinting, and contours </li> <li>what a datum is and why there are different datum </li> <li>explanations of the difference between geographic and grid coordinates </li> <li>how to quote grid references from topographic maps </li> <li>how to plan a successful trip using topographic maps </li> <li>using Global Positioning System (GPS) receivers and magnetic compasses with topographic maps </li> <li>using a topographic map to find your current position and to set a course. </li> </ul>
-
The Gold Rush Technology image set comprises 15 images and accompanying text that includes background information and descriptions of each image. The images depict methods used by Gold Rush miners, from simple alluvial panning to underground mining. The resource also includes modern gold exploration methods using geology and geophysics techniques. Possible student question/s for each slide are provided. Suitable for primary levels Years 5-6 and secondary levels Years 7-8
-
This Australian volcanoes image set comprises 15 images on CD-ROM with accompanying descriptive text and student question/s for each image. Learn the history of Australia's hot spot volcanoes over 60 million years and examine 9 Australian volcanoes in detail. Suitable for primary levels Years 5-6 and secondary levels Years 7-10
-
This video shows the locations of large earthquakes occurring in Australia in the last 50 years.
-
This is a mixture of maps and text explaining the area in fairly straightforward language.

