Hazard
Type of resources
Keywords
Publication year
Service types
Topics
-
Understanding disaster risk enables Government, industry and the community to make better decisions on how to prepare for disasters and improve the resilience of communities. Geoscience Australia develops and provides fundamental data and information to understand disaster risk so that we can determine how hazards impact the things that are valuable to us.
-
In November, 2018 a workshop of experts sponsored by UNESCO’s Intergovernmental Oceanographic Commission was convened in Wellington, New Zealand. The meeting was organized by Working Group (WG) 1 of the Pacific Tsunami Warning System (PTWS). The meeting brought together fourteen experts from various disciplines and four different countries (New Zealand, Australia, USA and French Polynesia) and four observers from Pacific Island countries (Tonga, Fiji), with the objective of understanding the tsunami hazard posed by the Tonga-Kermadec trench, evaluating the current state of seismic and tsunami instrumentation in the region and assessing the level of readiness of at-risk populations. The meeting took place in the “Beehive” Annex to New Zealand’s Parliament building nearby the offices of the Ministry of Civil Defence and Emergency Management. The meeting was co-chaired by Mrs. Sarah-Jayne McCurrach (New Zealand) from the Ministry of Civil Defence and Emergency Management and Dr. Diego Arcas (USA) from NOAA’s Pacific Marine Environmental Laboratory. As one of the meeting objectives, the experts used their state-of-the-science knowledge of local tectonics to identify some of the potential, worst-case seismic scenarios for the Tonga-Kermadec trench. These scenarios were ranked as low, medium and high probability events by the same experts. While other non-seismic tsunamigenic scenarios were acknowledged, the level of uncertainty in the region, associated with the lack of instrumentation prevented the experts from identifying worse case scenarios for non-seismic sources. The present report synthesizes some of the findings of, and presents the seismic sources identified by the experts to pose the largest tsunami risk to nearby coastlines. In addition, workshop participants discussed existing gaps in scientific knowledge of local tectonics, including seismic and tsunami instrumentation of the trench and current level of tsunami readiness for at-risk populations, including real-time tsunami warnings. The results and conclusions of the meeting are presented in this report and some recommendations are summarized in the final section.
-
Probabilistic earthquake hazard maps were prepared for the Fiji Islands. Damage has been caused by Fiji earthquakes around 1850, in 1884, 1902, 1919, 1932 (twice), 1953 and 1979. No previous assessment had produced a comprehensive description of the earthquake hazard in Fiji and the present study was initiated in 1990 when the author was attached to the Mineral Resources Department, Fiji. Collection and analysis of data continued at MRD until 1992 and the study was completed at the Australian Geological Survey Organisation in 1993-1997. The aim of the study was to produce probabilistic earthquake hazard maps which can be used in the National Building Code for Fiji, for design of special structures, for planning, for emergency management and for risk management. Few, if any, similar studies have been undertaken in the seismically active Southwest Pacific.
-
The Greater Metro Manila Area is one of the world's megacities and is home to about 12 million people. It is located in a region at risk from earthquakes, volcanic eruptions, tropical cyclones, riverine flooding, landslides and other natural hazards. Major flooding affected the Greater Metro Manila Area in September 2009 following the passage of Typhoon Ketsana (known locally as Typhoon Ondoy). Following this event, the Australian Aid Program supported Geoscience Australia to undertake a capacity building project with its partner agencies in the Government of the Philippines. The output of this project has been a series of risk information products developed by agencies in the Collective Strengthening of Community Awareness for Natural Disasters (CSCAND) group. These products quantify the expected physical damage and economic loss to buildings caused by earthquakes, tropical cyclone severe wind and riverine flooding across the Greater Metro Manila Area. Spatial data is a key input to the development of hazard models and information on exposure, or the 'elements at risk'. The development of a spatially enabled exposure database was a crucial element in the construction of risk information products for the Greater Metro Manila Area. The database provides one central repository to host consistent information about the location, size, type, age, residential population and structural characteristics of buildings within the area of interest. Unique spatial analysis techniques were employed to quantify and record important aspects of the built environment, for inclusion in the database. The process of exposure data development within the Greater Metro Manila Area, including a new application developed by Geoscience Australia for estimating the geometric characteristics of buildings from high resolution elevation data and multi-spectral imagery, will be presented.
-
Through Australian Department of Foreign Affairs and Trade, Geoscience Australia has been working closely with the Government of Papua New Guinea technical agencies (Rabaul Volcano Observatory, Port Moresby Geophysical Observatory, and Engineering Geology Branch) since September 2010 to enhance their capabilities to monitor and assess natural hazards. The objective of this program is to support the Government of Papua New Guinea in developing fundamental information and practices for the effective response and management of natural hazard events in PNG. Earthquakes as natural hazards are one of the key focus points of this project, as they continue to cause loss of life and widespread damage to buildings and infrastructure in Papua New Guinea. The country’s vulnerability to earthquakes is evident from the significant socio-economic consequences of recent major events in Papua New Guinea, e.g., a magnitude 7.5 earthquake that occurred in the Hela Province of Papua New Guinea in 2018. Earthquake risk is likely to increase significantly in the years to come due to the growth in population and urbanization in Papua New Guinea. However, earthquake risk, unlike hazard, can be managed and minimized. One obvious example would be minimizing earthquake risk by constructing earthquake-resistant structures following building standards. The high level of earthquake hazard of Papua New Guinea has been long recognised and the suite of building standards released in 1982 contained provisions to impart adequate resilience to buildings based on the best understanding of seismic hazard available at that time. However, the building standards and incorporated seismic hazard assessment for Papua New Guinea has not been updated since the 1980s. The integration of modern national seismic hazard models into national building codes and practices provides the most effective way that we can reduce human casualties and economic losses from future earthquakes. This report aims at partially fulfilling this task by performing a probabilistic seismic hazard assessment to underpin a revision of the earthquake loading component of the building standards of Papua New Guinea. The updated assessment offers many important advances over its predecessor. It is based on a modern probabilistic hazard framework and considers an earthquake catalogue augmented with an additional four decades-worth of data. The revised assessment considers advances in ground-motion modelling through the use of multiple ground-motion models. Also, for the first time, the individual fault sources representing active major and microplate boundaries are implemented in the input hazard model. Furthermore, the intraslab sources are represented realistically by using the continuous slab volume to constrain the finite ruptures of such events. This would better constrain the expected levels of ground motion at any given site in Papua New Guinea. The results suggest a high level of hazard in the coastal areas of the Huon Peninsula and the New Britain–Bougainville region, and a relatively low level of hazard in the southern part of the New Guinea Highlands Block. In comparison with the seismic zonation map in the current design standard, it can be noted that the spatial distribution used for building design does not match the bedrock hazard distribution of this study. In particular, the high seismic hazard of the Huon Peninsula in the revised assessment is not captured in the current seismic zoning map, leading to a significant under-estimation of hazard in PNG’s second-largest city, Lae. It can also be shown that in many other regions and community localities in PNG the hazard is higher than that regulated for the design of buildings having a range of natural periods. Thus, the need for an updated hazard map for building design has been confirmed from the results of this study, and a revised map is developed for consideration in a revised building standard of Papua New Guinea.
-
Many scientific talks by Geoscience Australia staff are published on YouTube. These documents provide summaries (‘crib sheets’) of the presentations along with easy access links to each part of the video. They are intended to help teachers of Year 11/12 classes learning about natural hazards
-
In June 2012 Geoscience Australia was commissioned by Commonwealth Scientific and Industrial Research Organisation (CSIRO) to undertake detailed wind hazard assessments for 14 Pacific Island countries and East Timor as part of the Pacific-Australia Climate Change Science and Adaptation Planning (PACCSAP) program. PACCSAP program follows on from work Geoscience Australia did for the Pacific Climate Change Science Program (PCCSP) looking at CMIP3 generation of climate models. The objective of this study is to improve scientific knowledge by examining past climate trends and variability to provide regional and national climate projections. This document presents results from current and future climate projections of severe wind hazard from tropical cyclones for the 15 PACCSAP partner countries describing the data and methods used for the analysis. The severe wind hazard was estimated for current (1981 to 2000) and future (2081 to 2100) climate scenarios. Tropical-cyclone like vortices from climate simulations conducted by CSIRO using six Coupled Model Intercomparison Project phase 5 (CMIP5) models (BCC-CSM1.1, NorESM1-M, CSIRO-Mk3.6, IPSL-CM5A, MRI-CGM3 and GFDL-ESM2M) as well as the International Best Track Archive for Climate Stewardship were used as input to the Geoscience Australia's Tropical Cyclone Risk Model to generate return period wind speeds for the 15 PACCSAP partner countries. The Tropical Cyclone Risk Model is a statistical-parametric model of tropical cyclone behaviour, enabling users to generate synthetic records of tropical cyclones representing many thousands of years of activity. The 500-year return period wind speed is analysed and discussed into more details in this report, since it is used as a benchmark for the design loads on residential buildings. Results indicate that there is not a consistent spatial trend for the changes in 500-year cyclonic wind speed return period when CMIP5 models are compared individually. BCC-CSM1M and IPSL-CM5A presented an increase in the annual TC frequency for East Timor, northern hemisphere and southern hemisphere. On the other hand, NorESM1M showed a decrease in the annual TC frequency for the same areas. The other three models showed a mixed of increase and decrease in their annual TC frequency. When CMIP5 models were analysed by partner county capitals for the 500-year cyclonic wind speed return period, IPSL-CM5A and GFDL-ESM2M models presented an increase in the cyclonic wind speed intensity for almost all capitals analysed with exception of Funafuti (GFDL-ESM2M), which presented a decrease of 0.7% and Honiara (IPSL-CM5A) with a decrease of 1.6%. The tropical cyclone annual frequency ensemble mean indicates an increase in the tropical cyclone frequency within all three regions considered in this study. When looking at individual capitals, a slight increase in the 500-year return period cyclonic wind speed ensemble mean varying between 0.8% (Port Vila) to 9.1% (Majuro) is noticed. A decline around 2.4% on average in the 500-year return period cyclonic wind speed ensemble mean is observed in Dili, Suva, Nukualofa and Ngerulmud. The ensemble spatial relative change did not show any particular consistency for the 500-year cyclonic wind speed. Areas where Marshall Islands and Niue are located presented an increase in the 500-year cyclonic wind speed while a decrease is observed in areas around South of Vanuatu, East of Solomon Islands, South of Fiji and some areas in Tonga. The information from the evaluation of severe wind hazard from tropical cyclones, together with other PACCSAP program outputs, will be used to build partner country capacity to effectively adapt and plan for the future and overcome challenges from climate change.
-
Severe TC Vance was one of the most intense cyclones to impact mainland Australia. The observed damage to buildings could be explained in terms of structural performance of those buildings. Combining the structural vulnerability of housing with an estimate of the maximum wind gusts, we can explore the possible impacts that a repeat of Vance would cause in Exmouth, and compare the outcomes with what occurred in 1999. The analysis of the impacts of TC Vance on present-day Exmouth shows that very few houses would be completely destroyed. Not surprisingly, older houses (pre-1980’s construction era, excluding the US Navy block houses) would dominate those destroyed, and most likely the timber-framed style houses, many of which were substantially damaged in TC Vance.
-
An evaluation of the likelihood of tropical cyclone-related extreme winds, incorporating local effects on wind speed.
-
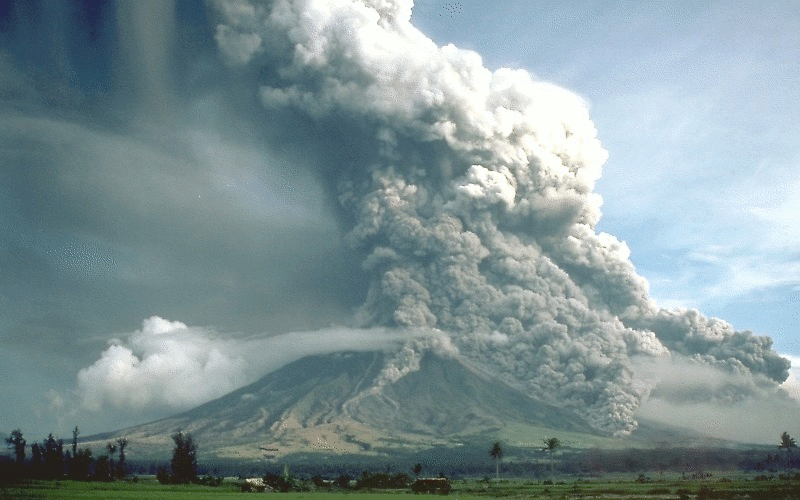
Activity for secondary and senior secondary students examining a hypothetical city and its vulnerability to volcanic hazard risk. Includes background information for teachers, PowerPoint presentation, student activity sheet and worked answers.