AusAEM
Type of resources
Keywords
Publication year
Topics
-
<p>The AusAEM Year 1 NT/QLD Airborne Electromagnetic Survey covers the Newcastle Waters and Alice Springs 1:1 Million map sheets in the Northern Territory and the Normanton and Cloncurry 1:1 Million map sheets in Queensland. CGG Aviation (Australia) Pty. Ltd. flew the 67,700-line kilometre survey between 2017 and 2018 using the TEMPEST® airborne electromagnetic system. Flown at 20-kilometre line spacing, data were acquired and processed under contract to Geoscience Australia. <p>This data package supersedes and replaces two earlier releases: June 11, 2018, and December 2018 (eCatID 120948) with revised calibrations and processing. Along with the regionally spaced (20 km) flight lines, it now includes 1,500 line kilometres of infill flying that was funded by private exploration companies and not previously released in view of time-bounded confidentiality agreements. The survey was commissioned by Geoscience Australia as part of the Exploring for the Future (EFTF) program. The EFTF program is led by Geoscience Australia (GA), in collaboration with the Geological Surveys of the Northern Territory, Queensland, South Australia and Western Australia, and is investigating the potential mineral, energy and groundwater resources in northern Australia and South Australia. The EFTF is a four-year $100.5 million investment by the Australian Government in driving the next generation of resource discoveries in northern Australia, boosting economic development across this region. This Data Release (Phase 1) Package contains the final survey deliverables produced by the contractor CGG, including: <p>a) The operations and processing report. <p>b) Final processed electromagnetic, magnetic and elevation point located line data. <p>c) Final processed electromagnetic, magnetic and elevation grids. <p>d) Conductivity estimates generated by the EM Flow® conductivity depth-imaging algorithm. <p>e) Graphical multi-plots of line data and EM Flow® conductivity sections. <p>f) Graphical stacked EM Flow® conductivity sections. <p>g) ESRI shape-files containing the flight line locations. <p>An updated release package (Phase 2), which contains results from our in-house inversion of the EM data (from this Phase 1 release), which includes the regional and infill areas are downloadable from the link provided in the Downloads tab.
-
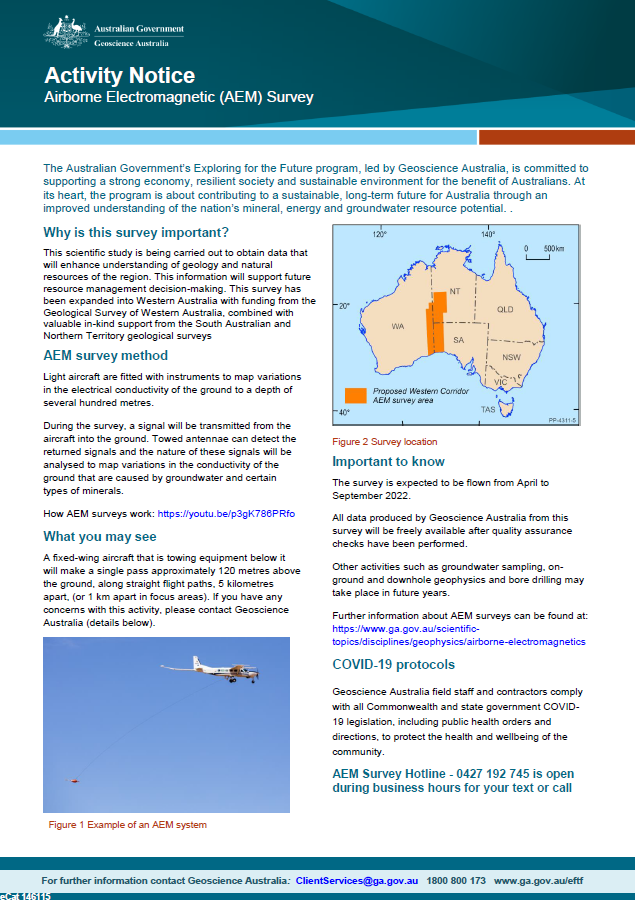
Geoscience Australia, in collaboration with state governments, will be carrying out airborne electromagnetic (AEM) surveys in western South Australia, southern NT and eastern WA during 2022. This scientific research is being carried out to obtain data that will enhance understanding of geology and natural resources of the region. This information will support future resource management decision-making. This survey has been expanded into Western Australia with funding from the Geological Survey of Western Australia, combined with valuable in-kind support from the South Australian and Northern Territory geological surveys. <p>
-
The discovery of strategically located salt structures, which meet the requirements for geological storage of hydrogen, is crucial to meeting Australia’s ambitions to become a major hydrogen producer, user and exporter. The use of the AusAEM airborne electromagnetic (AEM) survey’s conductivity sections, integrated with multidisciplinary geoscientific datasets, provides an excellent tool for investigating the near-surface effects of salt-related structures, and contributes to assessment of their potential for underground geological hydrogen storage. Currently known salt in the Canning Basin includes the Mallowa and Minjoo salt units. The Mallowa Salt is 600-800 m thick over an area of 150 × 200 km, where it lies within the depth range prospective for hydrogen storage (500-1800 m below surface), whereas the underlying Minjoo Salt is generally less than 100 m thick within its much smaller prospective depth zone. The modelled AEM sections penetrate to ~500 m from the surface, however, the salt rarely reaches this level. We therefore investigate the shallow stratigraphy of the AEM sections for evidence of the presence of underlying salt or for the influence of salt movement evident by disruption of near-surface electrically conductive horizons. These horizons occur in several stratigraphic units, mainly of Carboniferous to Cretaceous age. Only a few examples of localised folding/faulting have been noted in the shallow conductive stratigraphy that have potentially formed above isolated salt domes. Distinct zones of disruption within the shallow conductive stratigraphy generally occur along the margins of the present-day salt depocentre, resulting from dissolution and movement of salt during several stages. This study demonstrates the potential AEM has to assist in mapping salt-related structures, with implications for geological storage of hydrogen. In addition, this study produces a regional near-surface multilayered chronostratigraphic interpretation, which contributes to constructing a 3D national geological architecture, in support of environmental management, hazard mapping and resource exploration. <b>Citation: </b>Connors K. A., Wong S. C. T., Vilhena J. F. M., Rees S. W. & Feitz A. J., 2022. Canning Basin AusAEM interpretation: multilayered chronostratigraphic mapping and investigating hydrogen storage potential. In: Czarnota, K (ed.) Exploring for the Future: Extended Abstracts, Geoscience Australia, Canberra, https://dx.doi.org/10.26186/146376
-
This animation shows how Airborne Electromagnetic Surveys Work, when conducted by a rotary wing (helicopter) aircraft. It is part of a series of Field Activity Technique Engagement Animations. The target audience are the communities that are impacted by our data acquisition activities. There is no sound or voice over. The 2D animation includes a simplified view of what AEM equipment looks like, what the equipment measures and how the survey works.
-
<div><strong>Output Type: </strong>Exploring for the Future Extended Abstract</div><div><br></div><div><strong>Short Abstract:</strong> Under the Exploring for the Future (EFTF) program, Geoscience Australia staff and collaborators engaged with land-connected stakeholders that managed or had an interest in land comprising 56% of the total land mass area of Australia. From 2020 to 2023, staff planning ground-based and airborne geophysical and geological data acquisition projects consulted farmers, National Park rangers and managers, Native Title holders, cultural heritage custodians and other land-connected people to obtain land access and cultural heritage clearances for surveys proposed on over 122,000 parcels of land. Engagement did not always result in field activities proceeding. To support communication with this diverse audience, animations, comic-style factsheets, and physical models, were created to help explain field techniques. While the tools created have been useful, the most effective method of communication was found to be a combination of these tools and open two-way discussions.</div><div><br></div><div><strong>Citation: </strong>Sweeney, M., Kuoni, J., Iffland, D. & Soroka, L., 2024. Improving how we engage with land-connected people about geoscience. In: Czarnota, K. (ed.) Exploring for the Future: Extended Abstracts. Geoscience Australia, Canberra. https://doi.org/10.26186/148760</div>
-
To meet the increasing demand for natural resources globally, industry faces the challenge of exploring new frontier areas that lie deeper undercover. Here, we present an approach to, and initial results of, modelling the depth of four key chronostratigraphic packages that obscure or host mineral, energy and groundwater resources. Our models are underpinned by the compilation and integration of ~200 000 estimates of the depth of these interfaces. Estimates are derived from interpretations of newly acquired airborne electromagnetic and seismic reflection data, along with boreholes, surface and solid geology, and depth to magnetic source investigations. Our curated estimates are stored in a consistent subsurface data repository. We use interpolation and machine learning algorithms to predict the distribution of these four packages away from the control points. Specifically, we focus on modelling the distribution of the base of Cenozoic-, Mesozoic-, Paleozoic- and Neoproterozoic-age stratigraphic units across an area of ~1.5 million km2 spanning the Queensland and Northern Territory border. Our repeatable and updatable approach to mapping these surfaces, together with the underlying datasets and resulting models, provides a semi-national geometric framework for resource assessment and exploration. <b>Citation:</b> Bonnardot, M.-A., Wilford, J., Rollet, N., Moushall, B., Czarnota, K., Wong, S.C.T. and Nicoll, M.G., 2020. Mapping the cover in northern Australia: towards a unified national 3D geological model. In: Czarnota, K., Roach, I., Abbott, S., Haynes, M., Kositcin, N., Ray, A. and Slatter, E. (eds.) Exploring for the Future: Extended Abstracts, Geoscience Australia, Canberra, 1–4.
-
<div>The Australian wide airborne electromagnetic programme AusAEM stands as the largest survey of its kind aiming to cover the Australian continent at approximately 20 km line-spacing. It is transforming resource exploration, unveiling potential minerals and groundwater. </div><div><br></div><div>The open-access nature of AusAEM data and the modelling codes developed around it encourages collaboration between governments, industry, and academia, fostering a community focused on advancing geoscientific research and exploration.</div><div><br></div><div>Overall, the AusAEM program is an asset that can drive economic growth, support sustainable resource management, and enhance scientific understanding of Australia’s geological landscape.</div><div><br></div>
-
The Exploring for the Future (EFTF) program is unmatched for the scale of geoscience data acquisition across northern Australia, covering 37 648 individual land parcels and 2.9 million km2. The scale of works has raised many new challenges for Geoscience Australia (GA) through the diverse range of field activities, and the numerous stakeholders from different social and cultural backgrounds, across multiple jurisdictions. Success of the program depended on the development and maintenance of a social licence to operate. This was broadly achieved for fieldwork activities through early engagement with stakeholders, including free, prior and informed consent. Here, we present two case studies of stakeholder engagement for facilitation of data collection: one focuses on broadscale, low-impact field activities associated with the AusAEM survey; and the other on Indigenous-focused engagement related to the Barkly Seismic Survey. Because of the complexity of project planning and managing such a large number of stakeholders, GA’s project governance team was expanded; it now includes a dedicated Land and Marine Access team and a commitment to adopt world-leading engagement practices. One practice is to consider impacts and benefits for all stakeholders—not just landholders—of field activities and data acquisition programs. This includes a plan for how the data are delivered back to the communities and stakeholders, and how information exchanges can be built into projects. The aim is for stakeholders to hold GA in the highest regard and understand the benefits to the Australian people, and ultimately their own communities, from the geoscientific data that GA produces. <b>Citation:</b> Mouthaan, R., Buchanan, S. and Sweeney, M, 2020. Land access and Indigenous engagement for Australian geoscience. In: Czarnota, K., Roach, I., Abbott, S., Haynes, M., Kositcin, N., Ray, A. and Slatter, E. (eds.) Exploring for the Future: Extended Abstracts, Geoscience Australia, Canberra, 1–4.
-
The AusAEM1 survey is the world’s largest airborne electromagnetic survey flown to date, extending across an area exceeding 1.1 million km2 over Queensland and the Northern Territory. Approximately 60 000 line kilometres of data were acquired at a nominal line spacing of 20 km. Using this dataset, we interpreted the depth to chronostratigraphic surfaces, assembled stratigraphic relationship information, and delineated structural and electrically conductive features. Our results improved understanding of upper-crustal geology, led to 3D mapping of palaeovalleys, prompted further investigation of electrical conductors and their relationship to structural features and mineralisation, and helped us continuously connect correlative outcropping units separated by up to hundreds of kilometres. Our interpretation is designed to improve targeting and outcomes for mineral, energy and groundwater exploration, and contributes to our understanding of the chronostratigraphic, structural and upper-crustal evolution of northern Australia. More than 150 000 regional depth measurements, each attributed with detailed geological information, are an important step towards a national geological framework, and offer a regional context for more detailed, smaller-scale AEM surveys. <b>Citation:</b> Wong, S.C.T., Roach, I.C., Nicoll, M.G., English, P.M., Bonnardot, M.-A., Brodie, R.C., Rollet, N. and Ley-Cooper, A.Y., 2020. Interpretation of the AusAEM1: insights from the world’s largest airborne electromagnetic survey. In: Czarnota, K., Roach, I., Abbott, S., Haynes, M., Kositcin, N., Ray, A. and Slatter, E. (eds.) Exploring for the Future: Extended Abstracts, Geoscience Australia, Canberra, 1–4.
-
For the AusAEM Year 1 survey an inertial measurement unit (IMU) was installed for the first time on the TEMPEST receiver bird to measure its orientation and to augment GPS derived positioning of the receiver. This has given us the opportunity to develop better quality control and calibration procedures, which would otherwise not be possible. Theoretical modelling of the primary field on high altitude zero-lines, using the full position/orientation information, revealed discrepancies between observed and modelled data. It alerted us to time-lag parallaxes between EM and bird position/orientation data, some spurious IMU data on many pre-flight zero-lines, and a coordinate system sign convention inconsistency. The modelling also revealed systematic differences that we could attribute to the calibration of the receiver pitch and EM data scaling. We developed an inversion algorithm to solve for a receiver pitch offset and an EM scaling calibration parameter, for each zero-line, which minimised the systematic discrepancies. It eventuated that the calibration parameters fell into five distinct populations explicable by significant equipment changes. This gave us the confidence to use the medians of these populations as parameters to calibrate the data. The work shows the value of the new receiver bird orientation data and the importance of accurate IMU calibration after any modification. It shows the practical utility of quantitative modelling in the quality control workflow. It also demonstrates how modelling and inversion procedure can be used to successfully diagnose calibration issues in fixed-wing AEM data. Presented at the 2019 Australasian Exploration Geoscience Conference