GEOPHYSICS
Type of resources
Keywords
Publication year
Topics
-
The GEOPHYS_SURV database describes geophysical surveys (air, land, and marine), the datasets derived from those surveys, and the methods used for delivery of those datasets. The database includes metadata for all surveys conducted or managed by Geoscience Australia and its predecessor agencies, as well as data and surveys from State and Territory geological survey agencies.
-
In association with the OB2020 seismic survey, over 8,200 line kilometre of gravity and magnetic data were acquired. These data were subsequently merged with existing satellite data to produce merged grids at 1000m grid cell size. Several enhancement processing techniques were applied to these magnetic and gravity data to better highlight buried features within the Otway Basin. The merged input data from the survey and the enhanced products in this release provide valuable information on the geometry and spatial extent of igneous rocks in the deep-water basin. The distribution of these rocks is critical to the understanding of the petroleum systems and therefore the hydrocarbon prospectivity of the area. This data package contains: 1) A metadata statement document 2) Shapefiles of the magnetic and gravity line data from the OBSP survey 3) ASCII xyz grids of the OBSP and merged grids with public domain data 4) Georeferenced (GeoTIFF) images of the survey and merged grids 5) Gravity and Magnetic data processing reports from the OBSP survey
-
Drilling in the Geoscience Australia Exploring for the Future East Tennant project was conducted as part of the MinEx CRC National Drilling Initiative. Ten stratigraphic boreholes were drilled for scientific purposes in the region around the Barkly Roadhouse in the Northern Territory. Where possible, the boreholes were comprehensively wireline logged to obtain petrophysical data on the cover and basement rocks to help improve knowledge and geophysical models of the region. Formation density data obtained by wireline logging were validated using laboratory-based bulk density data obtained by Archimedes method on diamond drill core samples at Geoscience Australia. Results of the validation show that wireline-logged formation density data and Archimedes wet bulk density data are in good general agreement in the first five boreholes drilled (NDIBK01, NDIBK02, NDIBK03, NDIBK04 and NDIBK05). Difficult drilling and some lost drilling equipment meant that boreholes NDIBK06, NDIBK07 and NDIBK09 could not be cased properly, or could not be re-entered, and thus formation density wireline logs could not be obtained in these holes. Boreholes NDIBK08 and NDIBK10 were wireline logged, however formation density results from these last two holes were problematic. Wireline formation density results for borehole NDIBK08 are shown to be too high due to miscalibration of the wireline formation density tool, and results from borehole NDIBK10 cannot be robustly assessed because of a lack of sufficient Archimedes bulk density data needed to provide statistical relevance and validate the wireline formation density data.
-
The discovery of strategically located salt structures, which meet the requirements for geological storage of hydrogen, is crucial to meeting Australia’s ambitions to become a major hydrogen producer, user and exporter. The use of the AusAEM airborne electromagnetic (AEM) survey’s conductivity sections, integrated with multidisciplinary geoscientific datasets, provides an excellent tool for investigating the near-surface effects of salt-related structures, and contributes to assessment of their potential for underground geological hydrogen storage. Currently known salt in the Canning Basin includes the Mallowa and Minjoo salt units. The Mallowa Salt is 600-800 m thick over an area of 150 × 200 km, where it lies within the depth range prospective for hydrogen storage (500-1800 m below surface), whereas the underlying Minjoo Salt is generally less than 100 m thick within its much smaller prospective depth zone. The modelled AEM sections penetrate to ~500 m from the surface, however, the salt rarely reaches this level. We therefore investigate the shallow stratigraphy of the AEM sections for evidence of the presence of underlying salt or for the influence of salt movement evident by disruption of near-surface electrically conductive horizons. These horizons occur in several stratigraphic units, mainly of Carboniferous to Cretaceous age. Only a few examples of localised folding/faulting have been noted in the shallow conductive stratigraphy that have potentially formed above isolated salt domes. Distinct zones of disruption within the shallow conductive stratigraphy generally occur along the margins of the present-day salt depocentre, resulting from dissolution and movement of salt during several stages. This study demonstrates the potential AEM has to assist in mapping salt-related structures, with implications for geological storage of hydrogen. In addition, this study produces a regional near-surface multilayered chronostratigraphic interpretation, which contributes to constructing a 3D national geological architecture, in support of environmental management, hazard mapping and resource exploration. <b>Citation: </b>Connors K. A., Wong S. C. T., Vilhena J. F. M., Rees S. W. & Feitz A. J., 2022. Canning Basin AusAEM interpretation: multilayered chronostratigraphic mapping and investigating hydrogen storage potential. In: Czarnota, K (ed.) Exploring for the Future: Extended Abstracts, Geoscience Australia, Canberra, https://dx.doi.org/10.26186/146376
-
Geoscience Australia first sought feedback on a metadata standard for magnetotelluric (MT) time-series data in 2018 with the publication of a Preview article (Kirkby, 2019) outlining suggestions for metadata fields that should be collected when running an MT survey. This was the first step in standardising the MT formats used by the Australian MT community to ensure a cohesive community approach moving forward. Intrepid Geophysics was subsequently contracted by Geoscience Australia to investigate the current community sentiment around a metadata standard and report on the community’s requirements for a standardised data format. Intrepid Geophysics was chosen as an independent party that had no significant stake in the magnetotellurics discussion. This report is the third made to Geoscience Australia in a series investigating the needs of the Australian magnetotelluric community, with a focus on the definition of the metadata that should be collected along with the raw data of an MT survey. The findings were collated from interviews conducted in the preliminary stage of the project as well as an online questionnaire that was sent to those who had agreed to be contacted. Feedback was constructive, centring on standardisation of parameter naming schemes, adding parameters that were missing and could add value, and misclassification of parameters. Future work should focus on a more widespread community engagement program that involves system manufacturers as well as building the metadata structure around the chosen data format.
-
The magnetotelluric (MT) method is increasingly being applied to map tectonic architecture and mineral systems. Under the Exploring for the Future (EFTF) program, Geoscience Australia has invested significantly in the collection of new MT data. The science outputs from these data are underpinned by an open-source data analysis and visualisation software package called MTPy. MTPy started at the University of Adelaide as a means to share academic code among the MT community. Under EFTF, we have applied software engineering best practices to the code base, including adding automated documentation and unit testing, code refactoring, workshop tutorial materials and detailed installation instructions. New functionality has been developed, targeted to support EFTF-related products, and includes data analysis and visualisation. Significant development has focused on modules to work with 3D MT inversions, including capability to export to commonly used software such as Gocad and ArcGIS. This export capability has been particularly important in supporting integration of resistivity models with other EFTF datasets. The increased functionality, and improvements to code quality and usability, have directly supported the EFTF program and assisted with uptake of MTPy among the international MT community. <b>Citation:</b> Kirkby, A.L., Zhang, F., Peacock, J., Hassan, R. and Duan, J., 2020. Development of the open-source MTPy package for magnetotelluric data analysis and visualisation. In: Czarnota, K., Roach, I., Abbott, S., Haynes, M., Kositcin, N., Ray, A. and Slatter, E. (eds.) Exploring for the Future: Extended Abstracts, Geoscience Australia, Canberra, 1–4.
-
We present a resistivity model of the southern Tasmanides of southeastern Australia using Australian Lithospheric Architecture Magnetotelluric Project (AusLAMP) data. Modelled lower crustal conductivity anomalies resemble concentric geometries revealed in the upper crust by potential field and passive seismic data. These geometries are a key part of the crustal architecture predicted by the Lachlan Orocline model for the evolution of the southern Tasmanides, in which the Proterozoic Selwyn Block drives oroclinal rotation against the eastern Gondwana margin during the Silurian period. For the first time, we image these structures in three dimensions (3D) and show they persist below the Moho. These include a lower crustal conductor largely following the northern Selwyn Block margin. Spatial association between lower crustal conductors and both Paleozoic to Cenozoic mafic to intermediate alkaline volcanism and gold deposits suggests a genetic association i.e. fluid flow into the lower crust resulting in the deposition of conductive phases such as hydrogen, iron, sulphides and/or graphite. The 3D model resolves a different pattern of conductors in the lithospheric mantle, including northeast trending anomalies in the northern part of the model. Three of these conductors correspond to Cenozoic leucitite volcanoes along the Cosgrove mantle hotspot track which likely map the metasomatised mantle source region of these volcanoes. The northeasterly alignment of the conductors correlates with variations in the lithosphere-asthenosphere boundary (LAB) and the direction of Australian plate movement, and may be related to movement of an irregular LAB topography over the asthenosphere. By revealing the tectonic architecture of a Phanerozoic orogen and the overprint of more recent tectono-magmatic events, our resistivity model enhances our understanding of the lithospheric architecture and geodynamic processes in southeast Australia, demonstrating the ability of magnetotelluric data to image geological processes over time.
-
AusLAMP is a collaborative national project to cover Australia with long-period magnetotelluric (MT) data in an approximately 55 km spaced array. Signatures from past tectonothermal events can be retained in the lithosphere for hundreds of millions of years when these events deposit conductive mineralogy that is imaged by MT as electrically conductive pathways. MT also images regions of different bulk conductivity and can help to understand the continuation of crustal domains down into the mantle, and address questions on the tectonic evolution of Australia. The AusLAMP data presented here were collected as part of three separate collaborative projects involving several organisations. Geoscience Australia (GA), the Geological Survey of South Australia, the Geological Survey of New South Wales, the Geological Survey of Victoria, and the University of Adelaide all contributed staff and/or funding to collection of AusLAMP data; GA and AuScope contributed instrumentation. The data cover the Paleo-Mesoproterozoic Curnamona Province, the Neoproterozoic Flinders Ranges, and the Cambrian Delamerian Orogen, encompassing eastern South Australia and western New South Wales and western Victoria. This project represents the first electrical resistivity model to image the entire Curnamona Province and most of the onshore extent of the Delamerian Orogen, crossing the geographical state borders between South Australia, New South Wales and Victoria.
-
This animation shows how Airborne Electromagnetic Surveys Work, when conducted by a rotary wing (helicopter) aircraft. It is part of a series of Field Activity Technique Engagement Animations. The target audience are the communities that are impacted by our data acquisition activities. There is no sound or voice over. The 2D animation includes a simplified view of what AEM equipment looks like, what the equipment measures and how the survey works.
-
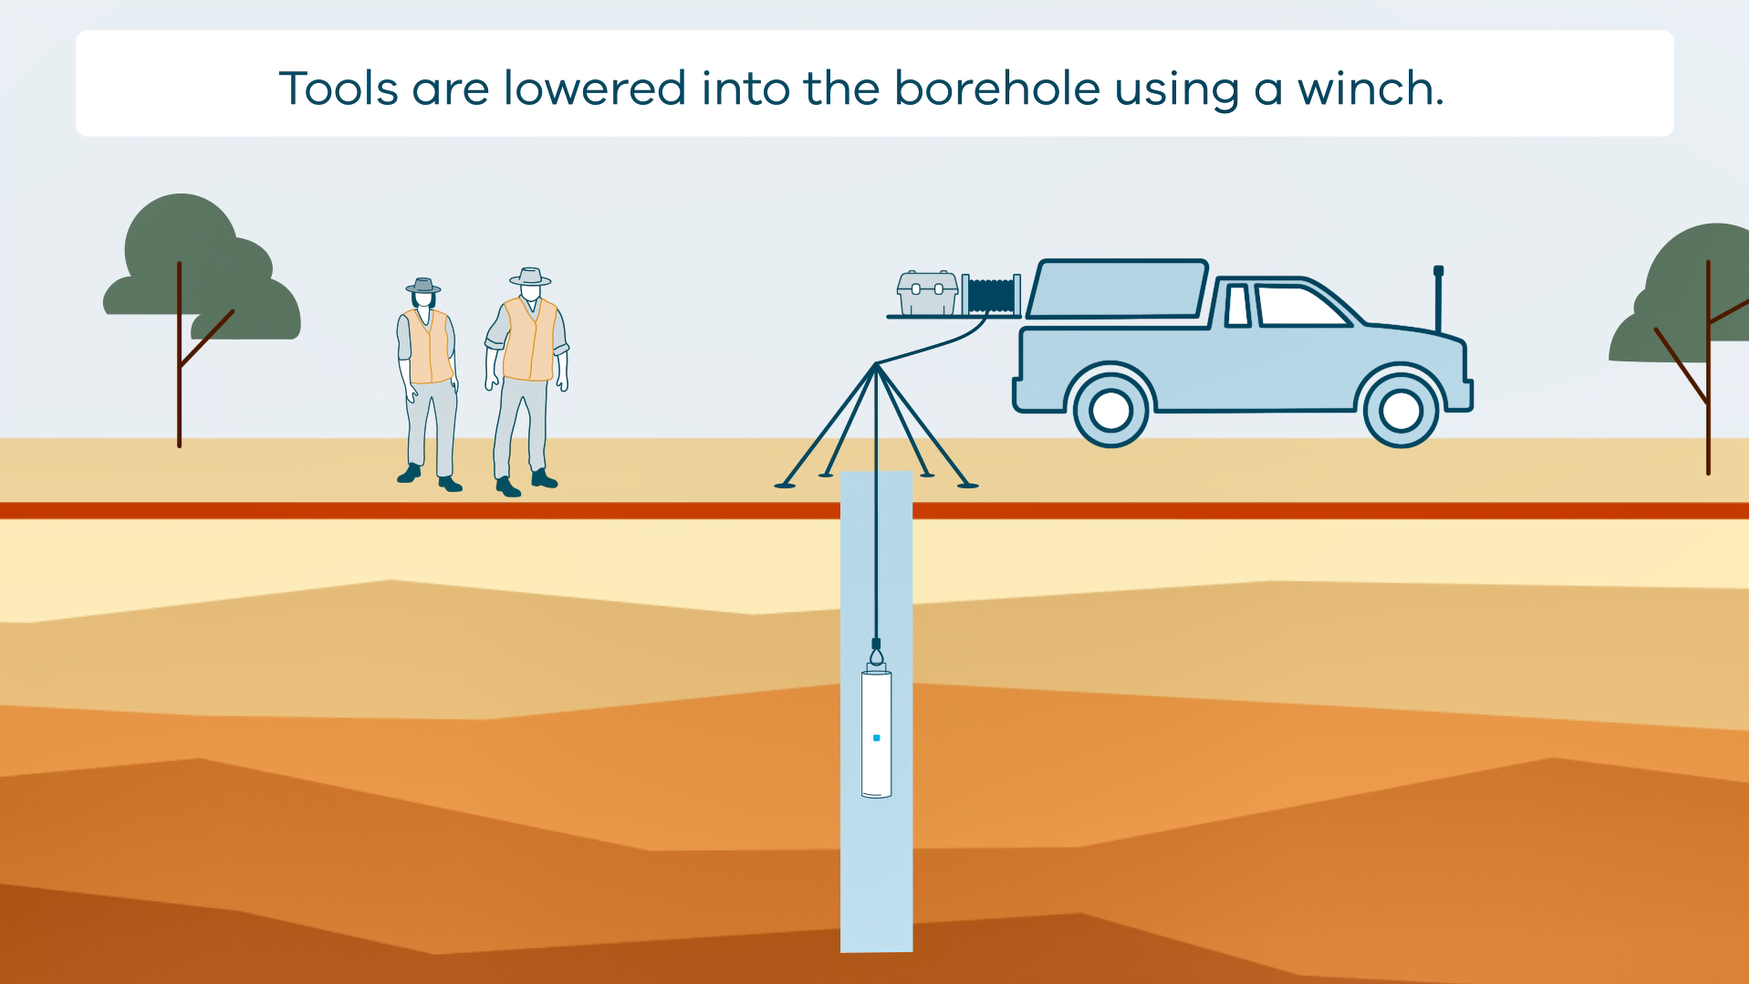
This animation shows how borehole geophysical surveys are conducted. It is part of a series of Field Activity Technique Engagement Animations. The target audience are the communities that are impacted by GA's data acquisition activities. There is no sound or voice over. The 2D animation includes a simplified view of what borehole geophysics equipment looks like, what the equipment measures and how scientists use the data.