10000000
Type of resources
Keywords
Publication year
Scale
Topics
-
No abstract available
-
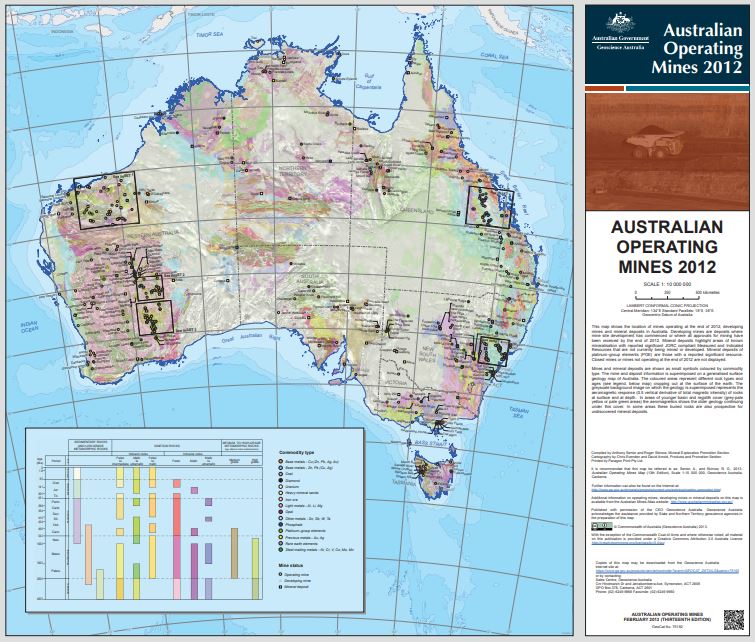
This map shows the locations of mines operating at the end of 2012, developing mines and mineral deposits in Australia. Developing mines are deposits with a proven minable resource and where mines site development has commenced or where a decision to mine has been announced. Mineral deposits highlight areas of know mineralisation with a proven or probable resource, that are not currently being mined or developed. Closed mines or mines not operating at the end of 2012 are not shown.
-
The map shows Mangenese resoruces
-
Map showing the location of publicly available Gravity data updated to May 2011
-
No abstract available
-
The Australia Epoch 1995.0 geomagnetic field chart maps the main geomagnetic field and its secular variation in the Australian region between 1995 and 2000 . The chart is derived from the Australian Geomagnetic Reference Field model (AGRF) of the same epoch. From 1990 to 2005 the AGRF has been updated at five yearly epochs. A main field model is produced for each five yearly epoch, along with a prospective secular variation model to extend the life of the model. The AGRF model represents the Earth's main magnetic field originating from the core and the broad scale crustal field. The AGRF does not model short term variations of the magnetic field with time, such as those caused by solar activity or ionspheric currents. The AGRF is derived from vector magnetic data from ground level, aircraft and satellite surveys as well as the network of geomagnetic observatories and repeat stations run by Geoscience Australia and neighbouring countries. (This chart is now superseded.)
-
During the period 1984-1996, AGSO compiled and produced a series of Palaeogeographic atlases of Australia for the Phanerozoic Eon. The Atlases - Cambrian, Ordovician, Silurian, Permian, Jurassic, and Cainozoic - contained maps which summarised the most important sedimentological data extracted from a wide variety of sources. Due to time and resource constraints four Periods (Devonian, Carboniferous, Triassic and Cretaceous) were not published, although data were compiled. Atlases consisted of a series of Data and Interpretation maps a Structure map, and supporting Stratigraphic Columns and text. Maps were compiled at a scale of 1:5 000 000 and digitally produced using MicroStation CAD software. The PALAEOGEOGRAPHIC ATLAS OF AUSTRALIA dataset has resulted from the conversion of the CAD atlas maps from all ten atlases into a format compatible with GIS applications. Important CAD elements such as lithology patterns have been retained for visualisation purposes. It is envisaged that this Palaeogeographic dataset will become part of the AGCRC Australia's Geodynamic Framework project.
-
Map showing Australian nickel resources
-
Australia 85 vertical magnetic intensity (Z) isomagnetic chart 1985.0 epoch 1:10M
-
Australia is not on the edge of a tectonic plate so why do we have earthquakes? The Indian-Australian plate is being pushed north and is colliding with the Eurasian, Philippine and Pacific plates. This causes stresses to build up in the interior of the plate which is released during earthquakes.