community
Type of resources
Keywords
Publication year
Service types
Topics
-
<div>As part of the Exploring for the Future Geoscience Knowledge Sharing project, a mobile laboratory was designed and built to help with field work and enhance opportunistic outreach experiences for communities in the areas where field work is taking place. This seminar explores some of the lessons learned from outreach programs planned and evaluated during 2023. The presenters will describe how the craft of stakeholder engagement can be improved by well researched and designed models and engagement exhibits. Outreach not only promotes the field program but also the work an agency does more broadly and can help scientists to better understand the general community who are consumers of data. This in turn can help with future planning of field and other work programs. </div><div><br></div>
-
The service contains the 2013 Earthquake Hazard map, as a raster and contours. This map shows the peak ground acceleration (response spectral period of 0.01 seconds) on rock expected for a 500 year return period, in units of g, evaluated for the geometric mean of the horizontal components. The map is the closest in return period and response spectral period to the current earthquake hazard map in the Australian Standard AS1170.4-2007.
-
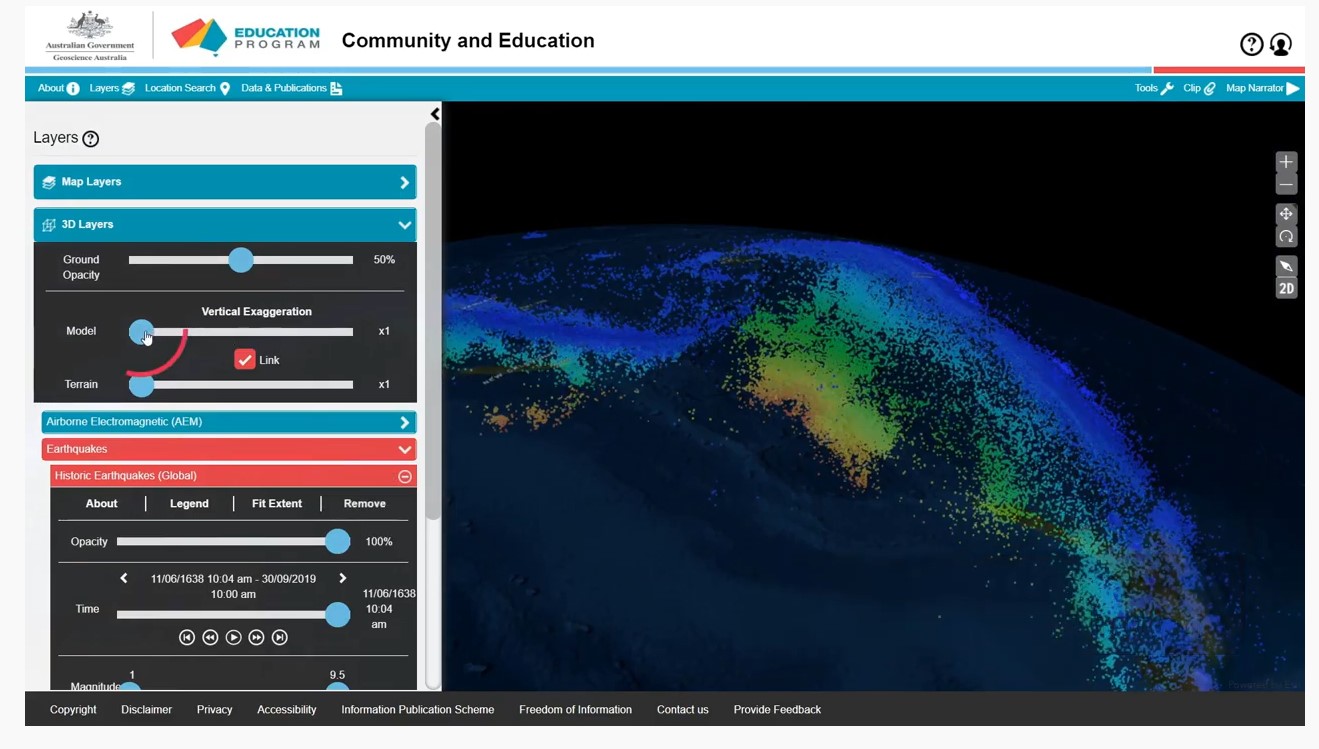
A series of short video clips illustrating how to use the Community and Education Data Portal (https://portal.ga.gov.au/persona/education). The Community and Education data portal is one of many data delivery portals available from Geoscience Australia, giving users access to a wealth of useful data and tools. It has been designed specifically for non-technical users, so that general community members, including educators, can access themed surface and subsurface datasets or images with enhanced capabilities including 3D visualisation, and online analysis tools. The User Guide Video complements the help menu in the portal. The User guide is broken into a series of topics 1. Introduction 2. Toolbar 3. Map layers 4. Multiple Layers 5. Background Layers and Sharing 6. 3D Layers 7. Tools 8. Custom Layers The step by step guides were produced by James Cropper.
-
<div>The Severe Wind Hazard Assessment for Queensland arose as a project to better understand the potential impacts of tropical cyclones (TCs) on population centres and elements of critical infrastructure in Queensland. The rationale for the project was reinforced by lessons from Severe Tropical Cyclone (STC) Debbie, the direct and indirect impacts of which affected a significant area of Queensland, stretching from Bowen to the City of Gold Coast and Northern New South Wales between 28 March and 7 April 2017, resulting in 14 mostly flood associated deaths, and more than A$3.5 billion in direct losses. The intent of the project is to explore and assess a range of scenarios that extend beyond the contemporary recollection of severe events in order to challenge decision making for rarer but higher-consequence events. The scenarios described in the report can be used to improve planning for severe tropical cyclone (TC) events and their impacts. This includes developing a better understanding of how the capabilities of emergency services and supporting elements may be impacted in actual events. </div><div><br></div><div>Scenarios were selected from the catalogue of synthetic events (i.e. events that did not actually occur but whose occurrence was as probable as those that did occur) generated for the 2018 Tropical Cyclone Hazard Assessment (TCHA; Arthur, 2018), in consultation with Queensland Fire and Emergency Services (QFES) and those local governments involved within the project. Two TC events were modelled for each location for this project – a Category 3 and a Category 5 TC -with ‘favourable’ tracks for impact analysis. In all scenarios, consideration was given to regional historical analogues for the selected synthetic tracks to better relate the scenario outputs to known or “lived” events. These categories were chosen as they represent events with a moderate and very low likelihood with respect to intensity, based on historical observations. This also accounts for the future climate of less TCs but more intense occurrences, highlighting the different impacts arising from different events. It is important to emphasise and understand that each individual TC event will be different and lead to different impacts. </div><div><br></div>
-
The AusSeabed Marine Data Portal provides openly accessible seabed data to users. This report details the results and recommendations following a community survey on the portals functionality and usability. The report informs future development of the AusSeabed Marine Data Portal to ensure it meets end-user needs.
-
A two part Indigenous-led and produced Aboriginal cultural heritage awareness training video for Geoscience Australia staff. The video explores a number of topics from the perspective of Traditional Owners and Custodians. Topics covered include: What is Country, Lore and Kinship; the importance of listening, connecting to Country and the transference of knowledge; Aboriginal cultural heritage legislation and policy in Australia, native title and cultural heritage; the impact of past policies; and, working towards best practice. The video complements Geoscience Australia's Land Access and Cultural Heritage Policy, Procedures and Best Practice Standards.
-
Papua New Guinea (PNG) is situated at the edge of the Pacific “ring of fire” and is exposed to frequent large earthquakes and volcanic eruptions. Earthquakes in PNG, such as 2018 Hela Province event (M7.5), continue to cause loss of life and widespread damage to buildings and infrastructure. Given its high seismic hazard, PNG would benefit from a dense seismic monitoring network for rapid (near real-time), as well as long-term, earthquake hazard and risk assessment. Geoscience Australia (GA) is working with technical agencies of PNG Government to deliver a Department of Foreign Affairs and Trade (DFAT) funded technical disaster risk reduction (DRR) program to increase community resilience on the impact of natural hazards and other secondary hazards. As part of this program, this study explores the feasibility of establishing a low-cost, community-based seismic network in PNG by first verifying the performance of the low-cost Raspberry Shake 4D seismograph, which includes a three-component strong-motion MEMs accelerometer and one (vertical) short-period geophone. A Shake device was deployed at the Rabaul Volcanological Observatory (RVO) for a period of one month (May 2018), relaying data in real-time via a 3G modem. To assess the performance of the device, it was co-located with global seismic network-quality instruments that included a three-component broadband seismometer and a strong motion accelerometer operated by GA and RVO, respectively. A key challenge for this study was the rather poor data service by local telecommunication operators as well as frequent power outages which caused repeated data gaps. Despite such issues, the Shake device successfully recorded several earthquakes with magnitudes as low as mb 4.0 at epicentral distances of 600 km, including earthquakes that were not reported by international agencies. The time-frequency domain comparisons of the recorded waveforms with those by the permanent RVO instruments reveal very good agreement in a relatively wide frequency range of 0.1-10 Hz. Based on the estimated noise model of the Shake device (seismic noise as well as instrument noise), we explore the hypothetical performance of the device against typical ground-motion amplitudes for various size earthquakes at different source-to-site distances. Presented at the 2018 Australian Earthquake Engineering Society (AEES) Conference
-
<div>Non-technical summaries of groundwater in the remote communities of Warburton, Kaltukatjara (Docker River), Warakurna, Wingellina, Wanarn, Mantamaru (Jameson) and Papulankutja (Blackstone). These summaries are based on research undertaken as part of the Musgrave Palaeovalley Project and full results are available in the Musgrave Palaeovalley Project Synthesis Report (https://dx.doi.org/10.26186/149406).</div>
-
The service contains the 2013 Earthquake Hazard map, as a raster and contours. This map shows the peak ground acceleration (response spectral period of 0.01 seconds) on rock expected for a 500 year return period, in units of g, evaluated for the geometric mean of the horizontal components. The map is the closest in return period and response spectral period to the current earthquake hazard map in the Australian Standard AS1170.4-2007.
-
We consider how our society can use data, information and knowledge of the Earth under a broad definition of geoscience to better connect with the Earth system. This is important in our changing world, in particular how geoscience contributes to our response to the societal impacts of the COVID-19 pandemic. Ultimately, informed decisions utilizing the best geoscience data and information provide key parts of our economic, environmental and cultural recovery from the pandemic. The connection to country and more widely connection to our planet and the greater Earth system that comes from personal experience has been especially challenged in 2020. Much of Australia’s population have been encouraged to stay in our homes, first because of major fires and more recently in response to isolation from the COVID-19 pandemic. Although domestic travel became increasingly allowable, international travel has been restricted for much longer. This has increased the importance of trusted data and information initially from domestic locations and for more extended time between countries that are now less accessible. We discuss ways that geoscience governs our discovery and use of minerals, energy and groundwater resources and builds resilience and adaptation to environmental and cultural change. A broad definition of geoscience also includes positioning and location data and information, such as through integrated digital mapping, satellite data and real-time precise positioning. Important here is sharing, with two-way exchange of data, information and knowledge about the Earth, through outreach in geoscience education programs and interactions with communities across Australia, into neighboring countries in Asia and the Pacific, and across the world. An aspiration is for geoscience to inform social license through evidence-based decisions, such as for land and marine access, for a strong economy, resilient society and sustainable environment. At Geoscience Australia, we have developed a ten years strategic plan (Strategy 2028) that guides us to be a trusted source of information on Australia’s geology and geography for government, industry and community decision making. This will contribute to a safer, more prosperous and well-informed Australia and its connection to neighbouring countries, such as in Asia, as well as people that are better connected to country and our planet. <b>Citation:</b> Hill, S., Thorne, J., Przeslawski, R., Mouthaan, R., Lewis, C. The 'new normal' for geoscience in a post-COVID world: connecting informed people with the Earth. <i>Thai Geoscience Journal</i> Volume 2 (2) 2021, p30-37 021 ISSN-2730-2695; DOI-10.14456/tgj.2021.3