DEA
Type of resources
Keywords
Publication year
Topics
-
<div>The United States Geological Survey's (USGS) Landsat satellite program has been capturing images of the Australian continent for more than 30 years. This data is highly useful for land and coastal mapping studies.</div><div><br></div><div>In particular, the light reflected from the Earth’s surface (surface reflectance) is important for monitoring environmental resources – such as agricultural production and mining activities – over time.</div><div><br></div><div>We make accurate comparisons of imagery acquired at different times, seasons and geographic locations. However, inconsistencies can arise due to variations in atmospheric conditions, sun position, sensor view angle, surface slope and surface aspect. These are reduced or removed to ensure the data is consistent and can be compared over time.</div><div><br></div><div>The Geoscience Australia Landsat 9 OLI TIRS Analysis Ready Data Collection 3 contains three sub-products that provide corrections or attribution information:</div><div>- DEA Surface Reflectance NBAR* (Landsat 9)</div><div>- DEA Surface Reflectance NBART** (Landsat 9)</div><div>- DEA Surface Reflectance OA*** (Landsat 9)</div><div><br></div><div>Note: DEA produces NBAR as part of the Landsat ARD, this is available in the National Computing Infrastructure environment only and is not available in the DEA cloud environments.</div><div><br></div><div>The resolution is a 30 m grid based on the USGS Landsat Collection 2 archive, or 15 m for the panchromatic band. This data forms part of the DEA Collection 3 archive. </div><div><br></div><div>* Nadir corrected Bi-directional reflectance distribution function Adjusted Reflectance (NBAR)</div><div>** Nadir corrected Bi-directional reflectance distribution function Adjusted Reflectance with terrain illumination correction (NBART)</div><div>*** Observation Attributes (OA)</div>
-
<div>The DEA Geometric Median and Median Absolute Deviation products use statistical analyses to provide information on variance in the landscape over a given year. They provide insight into the “average” conditions observed over Australia in a given year, as well as the amount of variability experienced around that average. These products are useful for monitoring change detection, such as from cropping, urban expansion or burnt area mapping. </div><div><br></div><div>Satellite imagery allows us to observe the Earth with significant accuracy and detail. However, missing data — such as gaps caused by cloud cover — can make it difficult to create a complete image. In order to produce a single, complete view of a certain area, satellite data must be consolidated by stacking measurements from different points in time to create a composite image. </div><div><br></div><div>The Digital Earth Australia GeoMAD (Geometric Median and Median Absolute Deviation) data product is a cloud-free composite of satellite data compiled annually over each calendar year. </div><div><br></div><div>Large-scale image composites are increasingly important for a variety of applications such as land cover mapping, change detection, and the generation of high-quality data to parameterise and validate bio-physical and geophysical models. A number of compositing methodologies are being used in remote sensing in general, however, challenges still exist. These challenges include mitigating against boundary artifacts due to mosaicking scenes from different epochs ensuring spatial regularity across the mosaic image and maintaining the spectral relationship between bands. </div><div><br></div><div>The creation of good composite images is especially important due to the opening of the United States Geological Survey’s Landsat archive. The greater availability of satellite imagery has resulted in demand to provide large regional mosaics that are representative of conditions over specific time periods while also being free of clouds and other unwanted visual noise. One approach is to ‘stitch together’ multiple selected high-quality images. Another is to create mosaics in which pixels from a time series of observations are combined (using an algorithm). This ‘pixel composite’ approach to mosaic generation provides more consistent results than with stitching high-quality images due to the improved colour balance created by combining one-by-one pixel-representative images. Another strength of pixel-based composites is their ability to be automated, hence enabling their use in large data collections and time series datasets. </div><div><br></div><div>The DEA GeoMAD product can be used for seeing how an area of land usually looks rather than only viewing it at a single point in time. Hence you can assess the land cover and land use on a general basis rather than at a specific date. It can also be used to assess how much an area changes over time. You will notice areas like bare rock that are very stable versus those like cropping areas that change dramatically. </div><div><br></div><div>The DEA GeoMAD product combines the Geometric Median and the Median Absolute Deviation algorithms in a single package. The Geometric Median output provides information on the general conditions of the landscape for a given year. Meanwhile the Median Absolute Deviation output provides information on how the landscape is changing in the same year. </div><div><br></div>
-
<div>Tasseled Cap percentiles provide an annual summary of how the environment has varied through a year. The Tasseled Cap percentiles provide the upper, lower and middle conditions as described by the 90th, 10th and 50th percentiles respectively, of greenness, wetness and brightness across the landscape.</div><div><br></div><div>These percentiles are intended for use as inputs into classification algorithms to identify such environmental features as wetlands and groundwater dependent ecosystems, and characterise salt flats, clay pans, salt lakes and coastal land forms.</div><div><br></div>
-
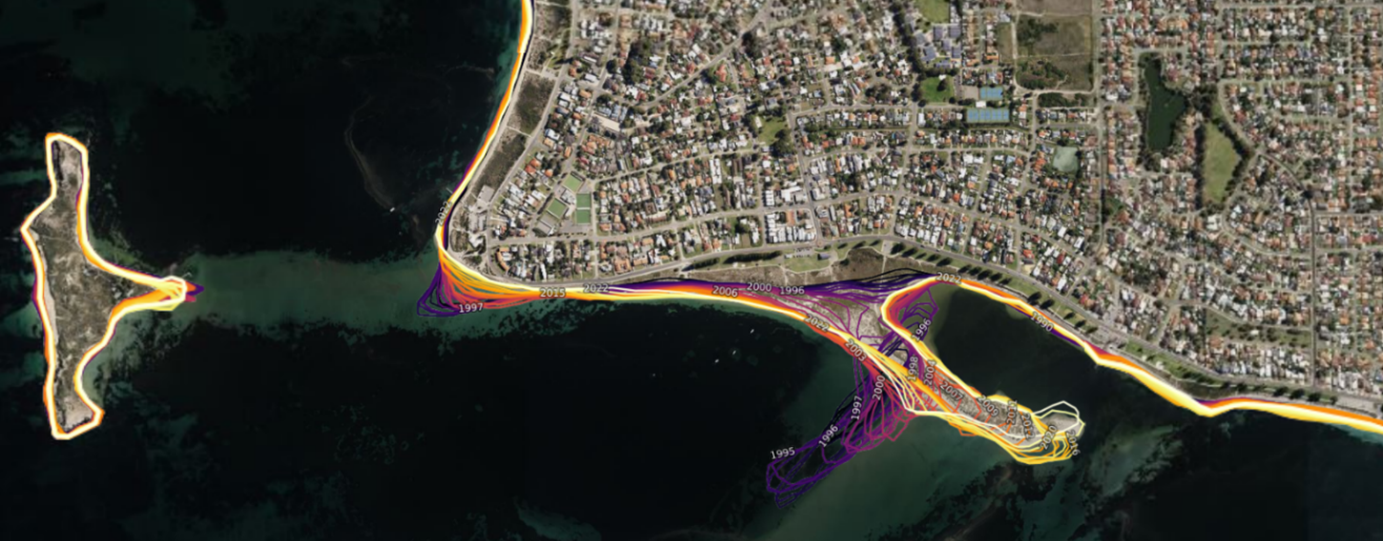
<b>This record has been superseded by eCat 148920 DEA Waterbodies v3.0 (Landsat) with approval from N.Mueller on 01/02/2024 This record was retired 15/09/2022 with approval from S.Oliver as it has been superseded by eCat 146197 DEA Waterbodies (Landsat) </b> <p>Up to date information about the extent and location of surface water provides all Australians with a common understanding of this valuable and increasingly scarce resource. <p>Digital Earth Australia Waterbodies shows the wet surface area of waterbodies as estimated from satellites. It does not show depth, volume, purpose of the waterbody, nor the source of the water. <p>Digital Earth Australia Waterbodies uses Geoscience Australia’s archive of over 30 years of Landsat satellite imagery to identify where almost 300,000 waterbodies are in the Australian landscape and tells us the wet surface area within those waterbodies. <p>It supports users to understand and manage water across Australia. For example, users can gain insights into the severity and spatial distribution of drought, or identify potential water sources for aerial firefighting during bushfires. <p>The tool uses a water classification for every available Landsat satellite image and maps the locations of waterbodies across Australia. It provides a timeseries of wet surface area for waterbodies that are present more than 10% of the time and are larger than 3125m2 (5 Landsat pixels). <p>The tool indicates changes in the wet surface area of waterbodies. This can be used to identify when waterbodies are increasing or decreasing in wet surface area.
-
<div>Intertidal environments contain many important ecological habitats such as sandy beaches, tidal flats, rocky shores, and reefs. These environments also provide many valuable benefits such as storm surge protection, carbon storage, and natural resources. </div><div> </div><div>Intertidal zones are being increasingly faced with threats including coastal erosion, land reclamation (e.g. port construction), and sea level rise. These regions are often highly dynamic, and accurate, up-to-date elevation data describing the changing topography and extent of these environments is needed. However, this data is expensive and challenging to map across the entire intertidal zone of a continent the size of Australia. </div><div> </div><div>The intertidal zone also forms a critical habitat and foraging ground for migratory shore birds and other species. An improved characterisation of the exposure patterns of these dynamic environments is important to support conservation efforts and to gain a better understanding of migratory species pathways. </div><div> </div><div>The <strong>DEA Intertidal </strong>product suite (https://knowledge.dea.ga.gov.au/data/product/dea-intertidal) provides annual continental -scale elevation and exposure products for Australia’s intertidal zone, mapped at a 10m resolution, from Digital Earth Australia’s archive of open-source Landsat and Sentinel-2 satellite data. These intertidal products enable users to better monitor and understand some of the most dynamic regions of Australia’s coastlines.</div><div><br></div><div><strong>Applications</strong></div><div><br></div><div> - Integration with existing topographic and bathymetric data to seamlessly map the elevation of the coastal zone. </div><div> </div><div> - Providing baseline elevation data for predicting the impact of coastal hazards such as storm surges, tsunami inundation, or future sea-level rise. </div><div> </div><div> - Investigating coastal erosion and sediment transport processes. </div><div> </div><div> - Supporting habitat mapping and modelling for coastal ecosystems extending across the terrestrial to marine boundary. </div><div> </div><div> - Characterisation of the spatio-temporal exposure patterns of the intertidal zone to support migratory species studies and applications. </div><div><br></div><div><br></div><div><br></div>
-
Analysis Ready Data (ARD) takes medium resolution satellite imagery captured over the Australian continent and corrects for inconsistencies across land and coastal fringes. The result is accurate and standardised surface reflectance data, which is instrumental in identifying and quantifying environmental change. This product is a single, cohesive ARD package, which allows you to analyse surface reflectance data as is, without the need to apply additional corrections. ARD consists of sub products, including : 1) NBAR Surface Reflectance which produces standardised optical surface reflectance data using robust physical models which correct for variations and inconsistencies in image radiance values. Corrections are performed using Nadir corrected Bi-directional reflectance distribution function Adjusted Reflectance (NBAR). 2) NBART Surface Reflectance which performs the same function as NBAR Surface Reflectance, but also applies terrain illumination correction. 3) OA Observation Attributes product which provides accurate and reliable contextual information about the data. This 'data provenance' provides a chain of information which allows the data to be replicated or utilised by derivative applications. It takes a number of different forms, including satellite, solar and surface geometry and classification attribution labels. ARD enables generation of Derivative Data and information products that represent biophysical parameters, either summarised as statistics, or as observations, which underpin an understanding of environmental dynamics. The development of derivative products to monitor land, inland waterways and coastal features, such as: - urban growth - coastal habitats - mining activities - agricultural activity (e.g. pastoral, irrigated cropping, rain-fed cropping) - water extent Derivative products include: - Water Observations from Space (WOfS) - National Intertidal Digital Elevation Model (NIDEM) - Fractional Cover (FC) - Geomedian ARD and Derivative products are reproduced through a period collection upgrade process for each sensor platform. This process applied improvements to the algorithms and techniques and benefits from improvements applied to the baseline data that feeds into the ARD production processes. <b>Value: </b>These data are used to understand distributions of and changes in surface character, environmental systems, land use. <b>Scope: </b>Australian mainland and some part of adjacent nations. Access data via the DEA web page - <a href="https://www.dea.ga.gov.au/products/baseline-data">https://www.dea.ga.gov.au/products/baseline-data</a>
-
<div>A package of deliverables for the Australian Research Data Commons (ARDC), Bushfire History Data Project, Work Package 5. If you require further information or access, please contact earth.observation@ga.gov.au</div><div><br></div><div>Outputs generated for this Project are interim and represent a snapshot of work to date, as of September 2023. Deliverables are developmental in nature and are under further advancement. Datasets or visualisations should not be treated as endorsed, authoritative, or quality assured; and should not be used for anything other than a minimal viable product, especially not for safety of life decisions. The eventual purpose of this information is for strategic decisions, rather than tactical decisions. For local data, updates and alerts, please refer to your State or Territory emergency or fire service.</div><div><br></div><div>The purpose of this Project (WP5) was to generate fire history products from Earth observation (EO) data available from the Landsat and Sentinel-2 satellites. WP5 aimed to implement a suite of automated EO-based algorithms currently in use by State and Territory agencies, to produce National-scale data products describing the timing, location, and extent of bushfires across Australia. WP5 outputs are published here as a “deliverable package”, listed as documents, datasets and Jupyter notebooks. </div><div><br></div><div>Burnt area data demonstrators were produced to a Minimum Viable Product level. Four burnt area detection methods were investigated: </div><div>* BurnCube (Geoscience Australia, ANU, (Renzullo et al. 2019)),</div><div>* Burnt Area Characteristics (Geoscience Australia, unpublished methodology),</div><div>* A version of the Victoria’s Random Forest (Victorian, Tasmanian and New South Wales Governments). Based on method as described in Collins et al. (2018), and</div><div>* Queensland’s RapidFire (Queensland Government, (Van den Berg et al. 2021). Please note that demonstrator burnt area data from the Queensland method was only investigated for the Queensland location. Data were sourced from Terrestrial Ecosystem Research Network (TERN) infrastructure, which is enabled by the Australian Government National Collaborative Research Infrastructure Strategy (NCRIS). </div><div><br></div><div>In addition demonstrator products that examine the use of Near Real Time satellite data to map burnt area, data quality and data uncertainty were delivered. </div><div><br></div><div>The algorithms were tested on several study sites:</div><div>* Eastern Victoria,</div><div>* Cooktown QLD,</div><div>* Kangaroo Island SA,</div><div>* Port Hedland WA, and</div><div>* Esperance WA.</div><div><br></div><div>The BurnCube (Renzullo et al. 2019) method was implemented at a national-scale using the Historic Burnt Area Processing Pipeline documented below “GA-ARDC-DataProcessingPipeline.pdf”. Continental-scale interim summary results were generated for both 2020 Calendar Year and 2020 Financial Year. Results were based upon both Landsat 8 and Sentinel-2 (combined 2a and 2b) satellite outputs, producing four separate interim products: </div><div>* Landsat 8, 2020 Calendar Year, BurnCube Summary (ga_ls8c_nbart_bc_cyear_3),</div><div>* Landsat 8, 2020 Financial Year, BurnCube Summary (ga_ls8c_nbart_bc_fyear_3),</div><div>* Sentinel 2a and 2b, 2020 Calendar Year, BurnCube Summary (ga_s2_ard_bc_cyear_3),</div><div>* Sentinel 2a and 2b, 2020 Financial Year, BurnCube Summary (ga_s2_ard_bc_fyear_3).</div><div> </div><div>The other methods have sample products for the study sites, as discussed in the "lineage" section. </div><div><br></div><div>The Earth observation approach has several limitations, leading to errors of omission and commission (ie under estimation and over estimation of the burnt area). Omission errors can result from: lack of visibility due to clouds; small or patchy fires; rapid vegetation regrowth between fire and satellite observation; cool understorey burns being hidden by the vegetation canopy. Commission errors can result from: incorrect cloud or cloud-shadow masking; high-intensity land-use changes (such as cropping); areas of inundation. In addition cloud and shadow masking lead to differences in elapsed time between reference imagery and observations of change resulting in differences in burn area detection. For more information on data caveats please see Section 7.6 of DRAFT-ARDC-WP5-HistoricBurntArea.</div><div><br></div><div>The official Project title is: The Australian Research Data Commons (ARDC), Bushfire Data Challenges Program; Project Stream 1: the ARDC Bushfire History Data Project; Work Package 5 (WP5): National burnt area products analysed from Landsat and Sentinel 2 satellite imagery.</div><div><br></div><div>We thank the Mindaroo Foundation and ARDC for their support in this work.</div>
-
<div>This document steps educators and students through some of the uses of the satellite data on the Digital Earth Australia (DEA) Portal, with a particular focus on changes to landscapes and coasts over time. Instructions and questions are provided so educators and students can explore the data sets as they work their way through the document. The document also gives a brief background on how satellites operate and how they capture imagery.</div><div><br></div>
-
<b>BACKGROUND</b> <p> <p>The United States Geological Survey's (USGS) Landsat satellite program has been capturing images of the Australian continent for more than 30 years. This data is highly useful for land and coastal mapping studies. <p>In particular, the light reflected from the Earth’s surface (surface reflectance) is important for monitoring environmental resources – such as agricultural production and mining activities – over time. <p>We need to make accurate comparisons of imagery acquired at different times, seasons and geographic locations. However, inconsistencies can arise due to variations in atmospheric conditions, sun position, sensor view angle, surface slope and surface aspect. These need to be reduced or removed to ensure the data is consistent and can be compared over time. <p> </p> <b>WHAT THIS PRODUCT OFFERS</b> <p> <p>GA Landsat 8 OLI/TIRS Analysis Ready Data Collection 3 takes Landsat 8 imagery captured over the Australian continent and corrects for inconsistencies across land and coastal fringes. The result is accurate and standardised surface reflectance data, which is instrumental in identifying and quantifying environmental change. <p> <p>The imagery is captured using the Operational Land Imager (OLI) and Thermal Infra-Red Scanner (TIRS) sensors aboard Landsat 8. <p> <p>This product is a single, cohesive Analysis Ready Data (ARD) package, which allows you to analyse surface reflectance data as is, without the need to apply additional corrections. <p> <p>It contains three sub-products that provide corrections or attribution information: <p> <p> 1) GA Landsat 8 OLI/TIRS NBAR Collection 3 <p> 2) GA Landsat 8 OLI/TIRS NBART Collection 3 <p> 3) GA Landsat 8 OLI/TIRS OA Collection 3 <p> <p>The resolution is a 30 m grid based on the USGS Landsat Collection 1 archive.
-
<b>This record was retired 02/03/2023 with approval from M. Wilson as it has been superseded by <a href="https://dx.doi.org/10.26186/146552">eCat 146552 </a>& <a href="https://dx.doi.org/10.26186/146551">eCat 146551</a></b> The Surface Reflectance product has been corrected to account for variations caused by atmospheric properties, sun position and sensor view angle at time of image capture. These corrections have been applied to all satellite imagery in the Sentinel-2 archive. This is undertaken to allow comparison of imagery acquired at different times,in different seasons and in different geographic locations. These products also indicate where the imagery has been affected by cloud or cloud shadow, contains missing data or has been affected in other ways. The Surface Reflectance products are useful as a fundamental starting point for any further analysis, and underpinall other optical derivedDigital Earth Australiaproducts.