Sedimentology
Type of resources
Keywords
Publication year
Service types
Topics
-
Poster describing how GA made the WASANT palaeovalley map (GEOCAT #73980).
-
Here we present the surficial geology map for the Vestfold Hills, East Antarctica. On the coast of Prydz Bay, the region is one of the largest ice-free areas in Antarctica. Surficial geology mapping at 1:2000 was undertaken with field observations in the 2018/19 and 2019/20 summer seasons as well as aerial photography and satellite imagery interpretation. Units are based on the Geological Survey of Canada Surficial Data Model Version 2.4.0 (Deblonde et al 2019).
-
This report presents the location and sources of sediment samples and observational data in the Vestfold Hills (between 68° 23' and 68° 40' S, 77° 50' and 78° 35' E) to provide physical and chemical properties, sedimentary processes, and glacial and marine history of the terrestrial environment. This compilation of samples and observations incorporates data collected from the 1970s to present from published and unpublished sources. Sample locations and types are presented here to make them more readily available for further analysis and interpretation. Samples and observations are presented as point locations and include sample type, analyses, and references to the original data source.
-
The upper Permian to Lower Triassic sedimentary succession in the southern Bonaparte Basin represents an extensive marginal marine depositional system that hosts several gas accumulations. Of these, the Blacktip gas field has been in production since 2009, while additional identified gas resources are under consideration for development. The sedimentary succession extends across the Permian–Triassic stratigraphic boundary, and shows a change in lithofacies changes from the carbonate dominated Dombey Formation to the siliciclastic dominated Tern and Penguin formations. The timing, duration, distribution and depositional environments of these formations in the Petrel Sub-basin and Londonderry High is the focus of this study. The sedimentary succession extending from the Dombey to the Penguin formations is interpreted to represent marginal marine facies which accumulated during a long-lasting marine transgression that extended over previous coastal and alluvial plain sediments of the Cape Hay Formation. The overlying Mairmull Formation represents the transition fully to marine deposition in the Early Triassic. Regional scale well correlations and an assessment of available biostratigraphic data suggest marginal marine deposition systems were initiated outboard before the End Permian Extinction event, subsequently migrated inboard at about the Permian–Triassic stratigraphic boundary, and continued to be deposited through the faunal and floral recovery phase as Triassic species became established. The depositional history of the basin is translated to a chronostratigraphic framework which has implications for predicting the character and distribution of petroleum system elements in the Petrel Sub-basin and Londonderry High. Appeared in The APPEA Journal 61(2) 699-706, 2 July 2021
-
A benthic sediment sampling survey (GA0356) to the nearshore areas of outer Darwin Harbour was undertaken in the period from 03 July to 14 September 2016. Partners involved in the survey included Geoscience Australia (GA), the Australian Institute of Marine Science (AIMS) and the Department of Environment and Natural Resources within the Northern Territory Government (NT DENR) (formerly the Department of Land and Resource Management (DLRM)). This survey forms part of a four year (2014-2018) science program aimed at improving knowledge about the marine environments in the regions around Darwin and Bynoe Harbour’s through the collection and collation of baseline data that will enable the creation of thematic habitat maps to underpin marine resource management decisions. This project is being led by the Northern Territory Government and is supported by the INPEX-led Ichthys LNG Project, in collaboration with - and co-investment from GA and AIMS. The program builds upon an NT Government project (2011-2011) which saw the collection of baseline data (multibeam echosounder data, sediment samples and video transects) from inner Darwin Harbour (Siwabessy et al. 2015). Radke, L., Smit, N., Li, J., Nicholas, T., Picard, K. 2017. Outer Darwin Harbour Shallow Water Sediment Survey 2016: GA0356 – Post-survey report. Record 2017/06. Geoscience Australia, Canberra. http://dx.doi.org/10.11636/Record.2017.006 This research was funded by the INPEX-led Ichthys LNG Project via the Northern Territory (NT) Government Department of Land Resource Management (DLRM) (now the Department of Environment and Natural Resources (DENR)), and co-investment from Geoscience Australia (GA) and Australian Institute of Marine Science (AIMS). We are grateful to the following agencies for providing boats and staff, and to the following personal for help with sample acquisition: NT DENR (Danny Low Choy and Rachel Groome), NT Fisheries (Wayne Baldwin, Quentin Allsop, Shane Penny, Chris Errily, Sean Fitzpatrick and Mark Grubert), NT Parks and Wildlife (Ray Chatto, Stewart Weorle, and Luke McLaren) and the Larrakia Rangers (Nelson Tinoco, Kyle Lewfat, Alan Mummery and Steven Dawson). Special thanks to the skippers Danny Low Choy, Wayne Baldwin, Stewart Weorle and Luke McLaren whose seamanship strongly guided the execution of this survey. AIMS generously allowed use of the aquarium and laboratory at the Arafura Timor Sea Research Facility, and Simon Harries and Kirsty McAllister helped with the setup. We would also like to acknowledge and thank GA colleagues including: Matt Carey, Ian Atkinson and Craig Wintle (Engineering and Applied Scientific Services) for the organisation of field supplies and the design of the new core incubation set-up. This dataset is published with the permission of the CEO, Geoscience Australia
-
Preamble -- The 'National Geochemical Survey of Australia: The Geochemical Atlas of Australia' was published in July 2011 along with a digital copy of the NGSA geochemical dataset (doi: 10.11636/Record.2011.020). The NGSA project is described here: www.ga.gov.au/ngsa. The present dataset contains additional geochemical data obtained on NGSA samples: the Plutonium Isotopes Dataset. Abstract -- Seventy three fine-fraction (<75 um) Top Outlet Sediment (TOS, 0 – 10 cm depth) NGSA samples from Queensland were analysed for the plutonium (Pu) isotopes 238Pu and 239+240Pu (unresolved 239Pu and 240Pu) to determine: (1) if Pu is detectable in the Australian environment; and (2) what the levels and ranges of Pu retention in selected Queensland catchment soils are. Radiochemical analyses were performed by alpha spectrometry at the radioanalytical laboratories of Radiation and Nuclear Sciences, Department of Health, Queensland, and at the Australian Radiation Protection and Nuclear Safety Agency (ARPANSA), Victoria. The method yielded a 239+240Pu trace-level detection limit of 0.04 mBq/g (equivalent to 10.4 fg/kg or 0.0056 net counts per minute) with a relative standard deviation (RSD) of 15.1%. The average tracer recovery was 69% (RSD 25%) over a 3-day count. Total analytical uncertainty ranged from 19% to 90% at close to detection limits. Field duplicate repeatability for 239+240Pu activity concentration ranged from 18% to 45%, which in part at least reflects the inherent heterogeneity of soil/sediments containing refractory particles exhibiting variation in Pu activity concentrations. Analytical duplicate repeatability for 239+240Pu activity concentration ranged from 10% to 23%, with the mean activity concentration and error of the replicates reported with propagation of errors. The results show a wide range of 239+240Pu activity concentration in the fine TOS NGSA samples across Queensland (N = 73): 239+240Pu: Min = <0.04 mBq/g; Med ± MAD (median absolute deviation) = 0.09 ± 0.07 mBq/g; Mean ± SD = 0.29 ± 0.72 mBq/g; 95th percentile = 1.53 mBq/g; Max = 4.88 mBq/g. In comparison the world average background is estimated at 0.2 mBq/g. Analytical results for 39% of samples were below detection. Six samples with 239+240Pu > 0.18 mBq/g (70th percentile) were also analysed for 238Pu by the same alpha spectrometry method. Results ranged from 0.04 to 0.1 mBq/g (N = 6). The complete dataset is available to download as a comma separated values (CSV) file from Geoscience Australia's website (https://pid.geoscience.gov.au/dataset/ga/144101).
-
<div>Geoscience Australia maintains a national collection of marine geological samples and analytical data from across the Australian region. Digital records of these datasets are held within the Marine Sediment Database (MARS), available as an online resource of c. 2.6 million entries. Here we have extracted data from MARS to collate sediment properties for over 15,000 seabed samples for use as a standalone dataset. Analytical data includes textural composition (mud, sand, gravel), summary statistics for particle size distributions, textural class and calcium carbonate values (where available). Information on sample water depth, location and marine survey is also provided. The sample set spans the coast, continental shelf, slope and deep ocean locations across the Australian marine region (covering the extent of the AusBathyTopo 250m 2023 grid). This dataset has utility for a broad range of purposes including seabed characterisation, sediment transport modelling, habitat characterisation, seabed engineering studies and fundamental geological and sedimentological research.</div><div><br></div><div>Additional metadata of this dataset are provided in the word document accompanied with the dataset. The metadata document describes the attribute table, the sediment carbonate classification and the sediment facies.</div>
-
This data package provides seismic interpretations that have been generated in support of the energy resource assessments under the Australia’s Future Energy Resources (AFER) project. Explanatory notes are also included. The AFER project is part of Geoscience Australia’s Exploring for the Future (EFTF) Program—an eight year, $225 million Australian Government funded geoscience data and precompetitive information acquisition program to inform decision-making by government, community and industry on the sustainable development of Australia's mineral, energy and groundwater resources. By gathering, analysing and interpreting new and existing precompetitive geoscience data and knowledge, Geoscience Australia is building a national picture of Australia’s geology and resource potential. This will help support a strong economy, resilient society and sustainable environment for the benefit of all Australians. The EFTF program is supporting Australia’s transition to a low emissions economy, industry and agriculture sectors, as well as economic opportunities and social benefits for Australia’s regional and remote communities. Further details are available at http://www.ga.gov.au/eftf. The seismic interpretations build on the recently published interpretations by Szczepaniak et al. (2023) by providing updated interpretations in the AFER Project area for the Top Cadna-owie (CC10) and Top Pre-Permian (ZU) horizons, as well as interpretations for 13 other horizons that define the tops of play intervals being assessed for their energy resource potential (Figure 1). Seismic interpretations for the AFER Project are constrained by play interval tops picked on well logs that have been tied to the seismic profiles using time-depth data from well completion reports. The Pedirka and Western Eromanga basins are underexplored and contain relatively sparse seismic and petroleum well data. The AFER Project has interpreted play interval tops in 41 wells, 12 seismic horizons (Top Cadna-owie and underlying horizons) on 238 seismic lines (9,340 line kilometres), and all 15 horizons on 77 recently reprocessed seismic lines (3,370 line kilometres; Figure 2). Note that it has only been possible to interpret the Top Mackunda-Winton, Top Toolebuc-Allaru and Top Wallumbilla horizons on the reprocessed seismic lines as these are the only data that provide sufficient resolution in the shallow stratigraphic section to confidently interpret seismic horizons above the Top Cadna-owie seismic marker. The seismic interpretations are provided as point data files for 15 horizons, and have been used to constrain the zero edges for gross-depositional environment maps in Bradshaw et al. (2023) and to produce depth-structure and isochore maps for each of the 14 play intervals in Iwanec et al. (2023). The data package includes the following datasets: 1) Seismic interpretation point file data in two-way-time for up to 15 horizons using newly reprocessed seismic data and a selection of publicly available seismic lines (Appendix A). 2) Geographical layers for the seismic lines used to interpret the top Cadna-owie and underlying horizons (Cadnaowie_to_TopPrePermian_Interpretation.shp), and the set of reprocessed lines used to interpret all 15 seismic horizons (All_Horizons_Interpretation.shp; Appendix B). These seismic interpretations are being used to support the AFER Project’s play-based energy resource assessments in the Pedirka and Western Eromanga basins.
-
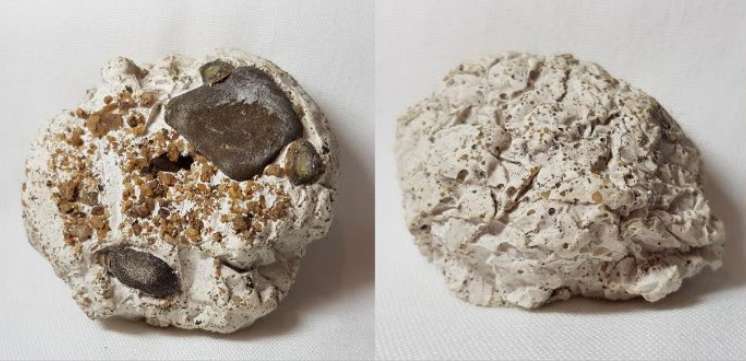
Would you like to make your own rock? In this set of activities you can simulate the natural processes that form sedimentary rocks in just a few hours, instead of taking millions and millions of years. All the activities can be undertaken using readily available materials. Supervision recommended.
-
Geoscience Australia has undertaken a regional seismic mapping study of the offshore Otway Basin extending across the explored inner basin to the frontier deep-water region. Seismic interpretation covers over 18000 line-km of new and reprocessed data acquired in the 2020 Otway Basin seismic program and over 40000 line-km of legacy 2D seismic data. We present new basin-scale isochore maps that show the distribution of the Cretaceous depocentres. Maps for the Lower Cretaceous Crayfish and Eumeralla supersequences, together with those recently published for the Upper Cretaceous Shipwreck and Sherbrook Supersequences, completes the set of isochore maps for the main tectonostratigraphic basin intervals. Mapping of basement involved faults has revealed structural fabrics that have influenced depocentre development. The tectonostratigraphic development of depocentres and maps of deep crustal units delineate crustal thinning trends related to late Cretaceous extension phases. This work highlights the need to review and update structural elements. For example, the boundary between the Otway and Sorell basins is now geologically constrained. The refinements to the tectonostratigraphic evolution of the Otway Basin presented here have important implications for the distribution and potential maturity of petroleum systems, especially with regard to heat flow associated with crustal extension. Presented at the 2024 Australian Energy Producers Conference & Exhibition (AEP) (https://energyproducersconference.au/conference/)