Magnetic
Type of resources
Keywords
Publication year
Service types
Topics
-
<p>Geoscience Australia (GA) generated a series of gravity and magnetic grids and enhancements covering Northern Australia. Several derivative gravity datasets have been generated 1) for the North-West Shield Western Australia region (approximately between latitudes 7‒26⁰ S and longitudes 110‒130⁰ E), 2) for the Northern Territory (approximately between latitudes 7‒26⁰ S and longitudes 125.5‒141⁰ E) and for Queensland (approximately between latitudes 7‒30⁰ S and longitudes 135‒160⁰ E). The magnetic dataset has been generated only for the North-West Shield Western Australia region (approximately between latitudes 7‒26⁰ S and longitudes 110‒130⁰ E). The magnetic and gravity data were downloaded from the Geophysical Archive Data Delivery System (GADDS), website (http://www.geoscience.gov.au/cgi-bin/mapserv?map=/nas/web/ops/prod/apps/mapserver/gadds/wms_map/gadds.map&mode=browse). Satellite Free-air (FA) gravity v27.1 (released March 11, 2019) and Satellite Topography v19.1 (released January 14, 2019) data were sourced from Sandwell et al. (2014) and downloaded from the Scripps Institution of Oceanography (SIO), National Oceanic and Atmospheric Administration (NOAA), U.S. Navy and National Geospatial-Intelligence Agency (NGA) (SIO Satellite Geodesy, website, http://topex.ucsd.edu/WWW_html/mar_grav.html). The Satellite Bouguer gravity grid with onshore correction density of 2.67 gcm-3 and offshore correction density of 2.20 gcm-3 was derived from the Free-air gravity v27.1 and Topography data V19.1. This Bouguer gravity grid was used for filling areas of data gaps in the offshore region. <p>Data evaluation and processing of gravity and magnetic data available in the area of interest resulted in the production of stitched onshore-offshore Bouguer gravity grid derived from offshore satellite Bouguer gravity grid and GA’s onshore ground and airborne gravity survey data and a stitched Total Magnetic Intensity (TMI) grid derived from airborne and shipborne surveys (Tables 1 and 5). A Reduction to the Pole (RTP) grid was derived from the stitched TMI grid. The TMI, RTP, FA and terrain corrected Bouguer gravity anomalies are standard datasets for geological analysis. The free-air gravity anomaly provides the raw and basic gravity information. Images of free-air gravity are useful for first-pass interpretation and the data is used for gravity modelling. Magnetic anomalies provide information on numerous magnetic sources, including deep sources as arising from the structure and composition of magnetic basement and shallow sources such as intra-sedimentary magnetic units (e.g. volcanics, intrusions, and magnetic sedimentary layers). A standard TMI image will contain information from all these sources. Geosoft Oasis montaj software was used throughout the data processing and enhancement procedure and the montaj GridKnit module was used to generate the stitched gravity and magnetic grids. <p>Enhancement techniques have been applied to the final processed Bouguer gravity and RTP magnetic grids to highlight subtle features from various sources and to separate anomalies from different source depths. These enhancement techniques are described in the next section. <p>Enhancement processing techniques and results <p>A summary of image processing techniques used to achieve various outcomes is described in Table 1. <p>Data type Filter applied Enhancement/outcome <p>Gravity/Magnetic First vertical derivative (1VD) Near surface features (e.g. intrabasinal) <p>Gravity/Magnetic Upward continuation Noise reduction in data <p>Gravity/Magnetic Low pass filter, or large distance upward continuation Enhancement of deep features (e.g. basement) <p>Gravity/Magnetic High pass filter Enhancement of shallow features (e.g. surface anomalies) <p>Gravity/Magnetic Tilt filter and 1VD Enhancement of structure (e.g. in basement) <p>Gravity/Magnetic ZS-Edgezone and ZS-Edge filters Enhancement of edges <p>Gravity/Magnetic horizontal modulus / horizontal gradient Enhancement of boundaries <p>Magnetic RTP (reduction to the pole), Compound Anomaly, and Analytic Signal filter Accurate location of sources
-
<p>The Exploring for the Future (EFTF) initiative aims to reduce the technical risk of mineral exploration by providing pre-competitive data and information to support investment and mineral exploration in northern Australia – a key part of ensuring Australia's future economic prosperity. <p>To support the EFTF initiative, the presence of hydrothermal alteration systems associated with iron oxide copper-gold (IOCG) deposits were estimated throughout the Tennant Creek -– Mt Isa Project area of northern Australia. These zones are of economic interest due to their potential to host copper, gold, uranium and rare earth element mineralisation. <p>To predict the presence of IOCG-related alteration, gravity and magnetic intensity data were used to produce 3D models of density and magnetic susceptibility, respectively. The inversion models provide an indication of the volume and distribution of these physical properties within the subsurface and were used to define volumes with relatively high densities and high magnetic susceptibilities as proxies for magnetite-rich alteration and volumes with high density, but low magnetic susceptibility, as proxies for hematite-rich alteration. <p>Contact zones between these two sets of volumes are considered to be the most favourable areas for potential IOCG mineralisation. However, the inversion modelling inevitably will have mapped a number of ‘false positives’, which will require more detailed inversion modelling and/or other data sets to discriminate these from true IOCG-related alteration.
-
Survey conducted by the Commonwealth Government or State/Territory Geological Survey (or equivalent) collecting airborne geophysical data
-
Survey conducted by the Commonwealth Government or State/Territory Geological Survey (or equivalent) collecting airborne geophysical data
-
Geoscience Australia is the custodian of the most comprehensive publicly available Australian airborne magnetic, gamma-ray, seismic, electromagnetic and gravity data sets. The airborne geophysics data set contains approximately 34 million line kilometres of data, which, at current prices, would cost approximately $197 million to acquire. The gravity data set contains more than 1.57 million reliable onshore stations gathered during more than 1800 surveys. The collection also includes a large number of seismic surveys from Australia's offshore basins. The onshore component of this data set was previously approved for RDSI for 8 TB. This proposal extends the collection to 150TB. The data types and access methods for the Offshore and Onshore data are identical Certain holdings are additionally hosted at the NCI (see downloads)
-
<p>The Geological Survey of South Australia commissioned the Gawler Craton Airborne Survey (GCAS) as part of the PACE Copper initiative. The airborne geophysical survey was flown over parts of the Gawler Craton in South Australia. The program was designed to capture new baseline geoscientific data to provide further information on the geological context and setting of the area for mineral systems (http://energymining.sa.gov.au/minerals/geoscience/pace_copper/gawler_craton_airborne_survey). <p>The survey design of 200 m spaced lines at a ground clearance of 60 m can be compared with the design of previous regional surveys which generally employed 400 m line spacing and a ground clearance of 80 m. The new survey design results in ~2 x the data coverage and ~25% closer to the ground when compared to previous standards for regional surveys in South Australia. <p>Survey blocks available for download include: <p>Streaky Bay, block 5 <p>Gairdner, block 6A <p>Spencer, block 7 <p>Kingoonya, block 9B <p>The following grids are available in this download: <p>• Laser-derived digital elevation model grids (m). Height relative to the Australian Height Datum. <p>• Radar-derived digital elevation model grids (m). Height relative to the Australian Height Datum. <p>• Total magnetic intensity grid (nT). <p>• Total magnetic intensity grid with variable reduction to the pole applied (nT). <p>• Total magnetic intensity grid with variable reduction to the pole and first vertical derivative applied (nT/m). <p>• Dose rate concentration grid (nGy/hr). <p>• Potassium concentration grid (%). <p>• Thorium concentration grid (ppm). <p>• Uranium concentration grid (ppm). <p>• NASVD processed dose rate concentration grid (nGy/hr). <p>• NASVD processed potassium concentration grid (%). <p>• NASVD processed thorium concentration grid (ppm). <p>• NASVD processed uranium concentration grid (ppm). <p>The following point located data are available in this download: <p>• Elevation. Height relative to the Australian Height Datum. Datum: GDA94 <p>• Total Magnetic Intensity. Datum: GDA94 <p>• Radiometrics. Datum: GDA94
-
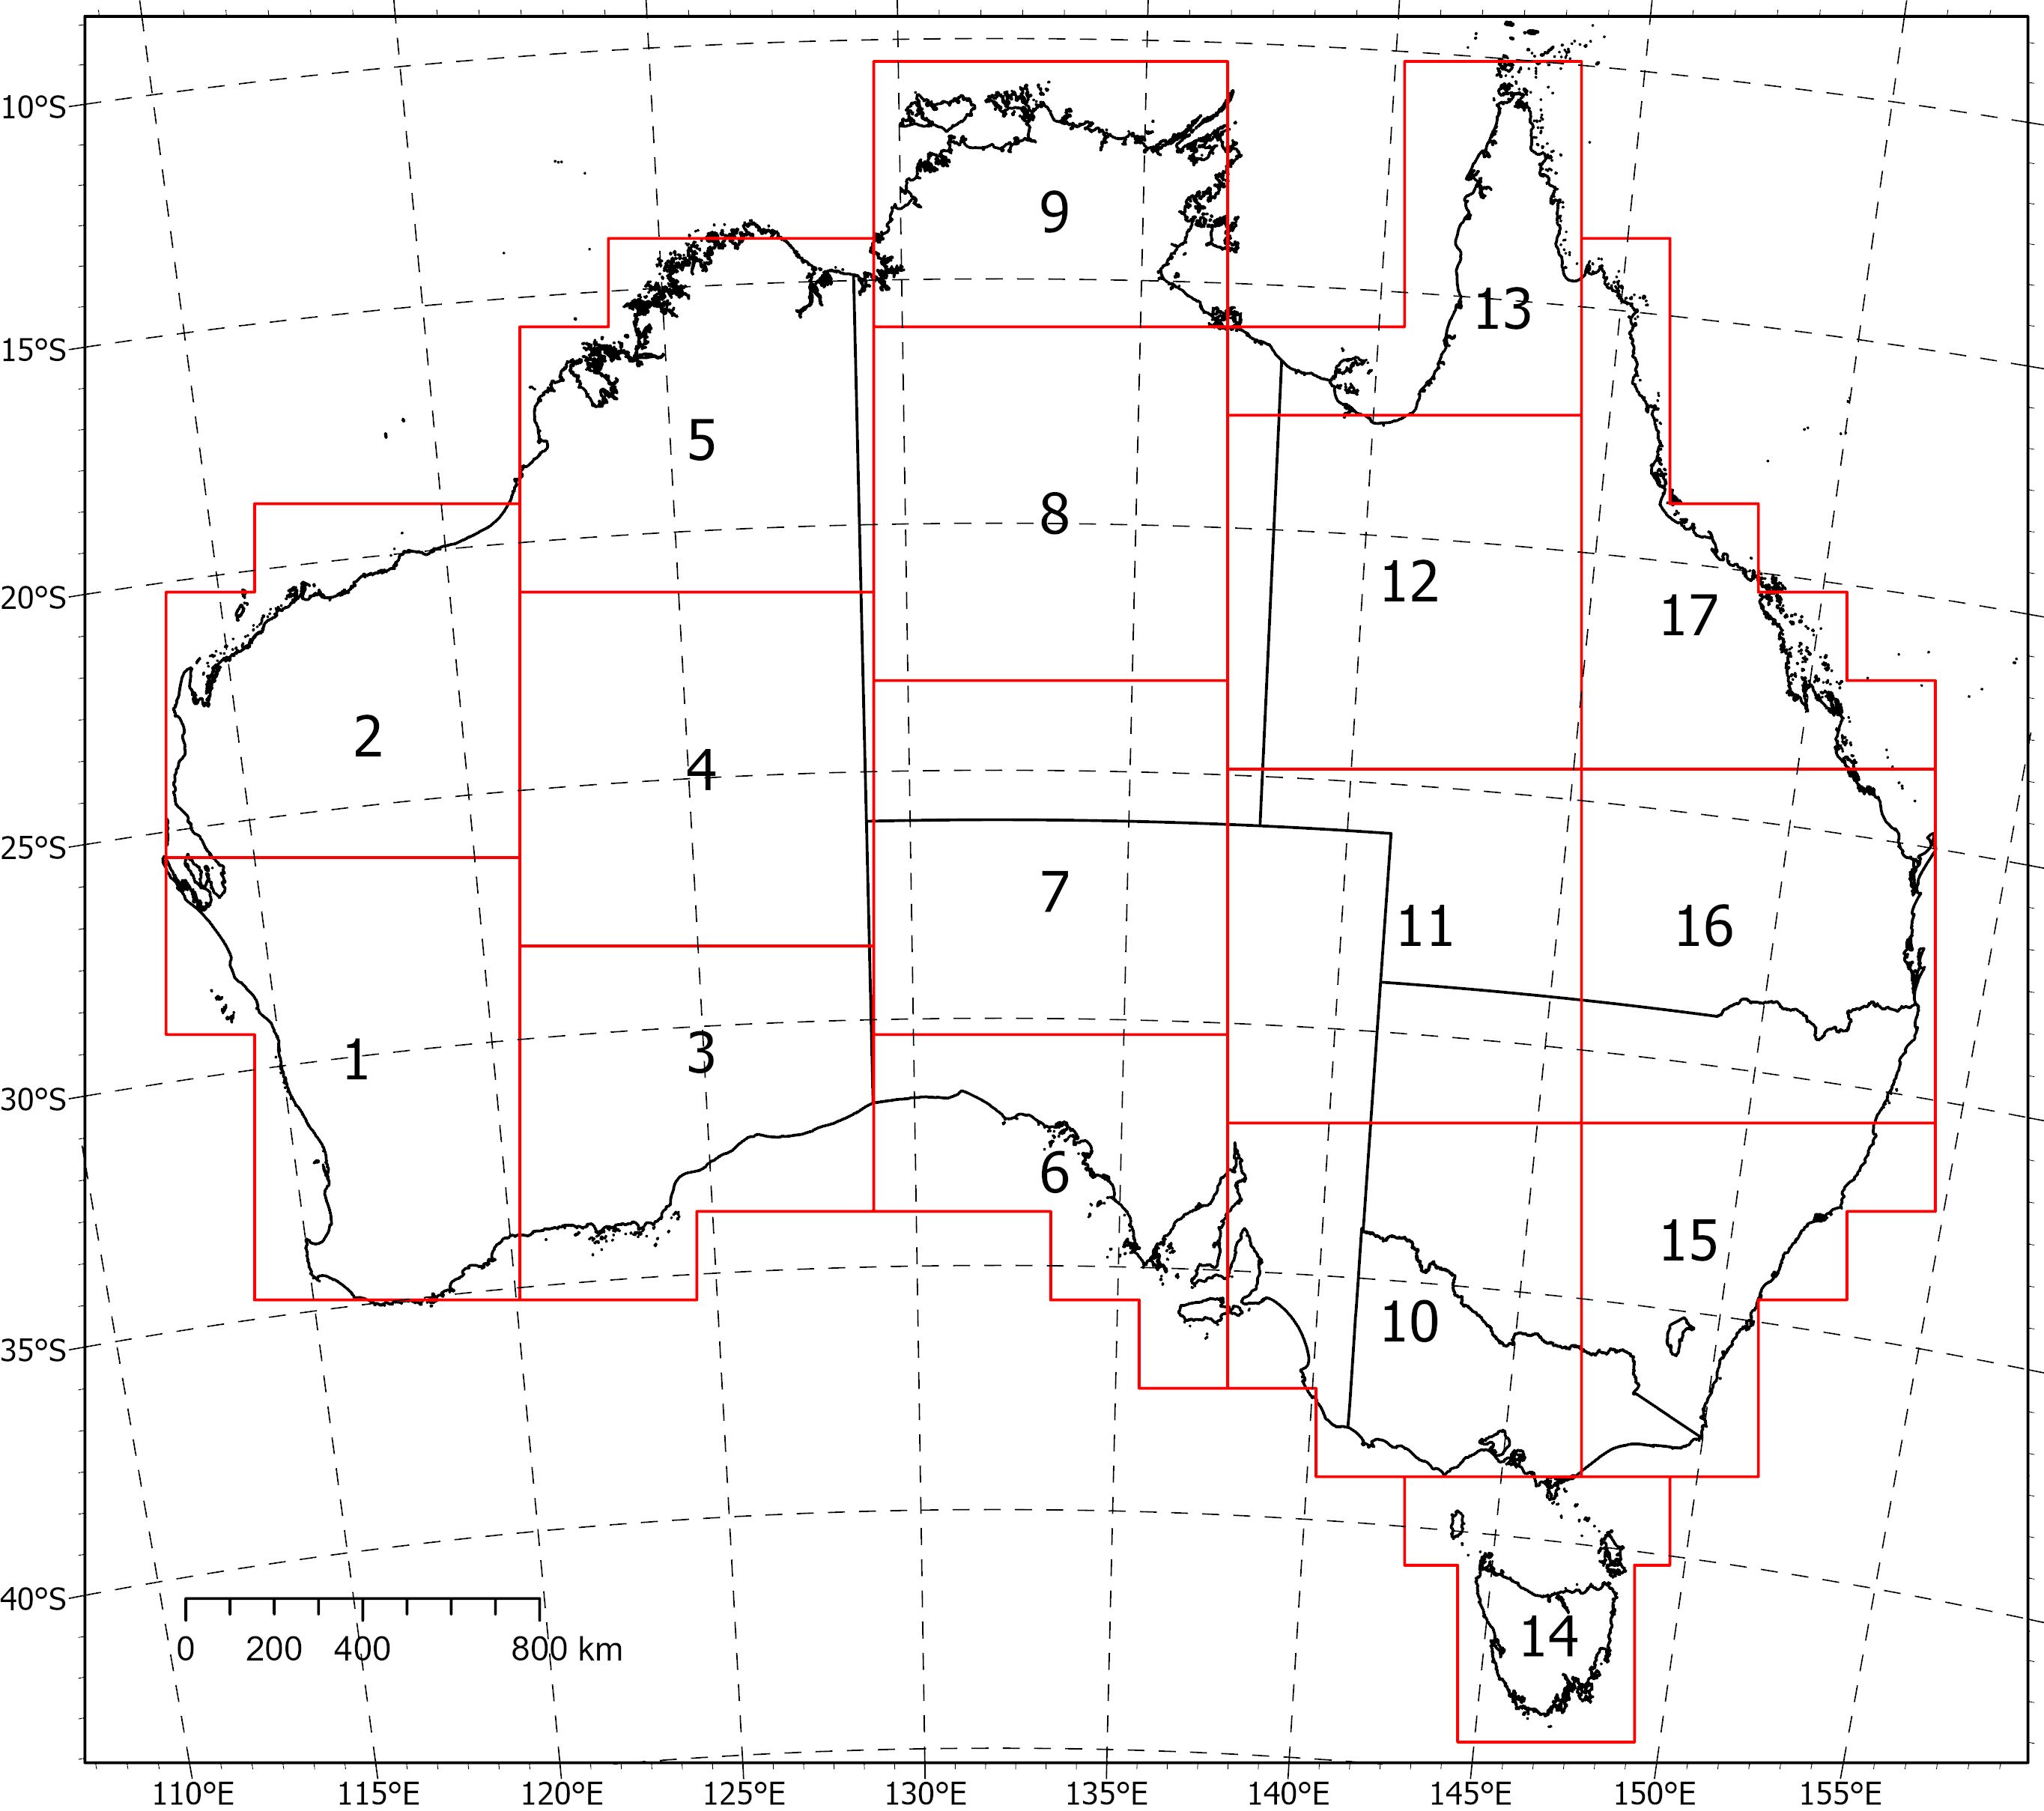
Two coincident, crustal-scale models, one of magnetic susceptibility and one of density, have been produced for a volume covering the Australian continent and extending down to 55.5 km depth. These models were produced using the UBC GIF MAG3D and GRAV3D inversion programs, respectively. The inversions were constrained with geological reference models with layers for sediments, undifferentiated crust and the mantle. The reference model for the magnetic inversion incorporated a Curie depth surface below which magnetic susceptibility was set to zero. Due to the size of the inversion problem to be solved, the volume was divided into 235 overlapping inversions, which were inverted separately and then recombined. The method of recombining the inversions relies on a cosine function to determine the weight of each property and then takes a weighted average. This method successfully attenuated the edge effects that would otherwise occur between models and allows them to be viewed as one seamless model that covers the whole of Australia. Regions of coincident high-density (>2.83 g/cm<sup>3</sup>) and high-magnetic susceptibility (>0.0125 SI) within the top 10 km of the undifferentiated crust (termed magnetite proxies) are suggested to be related to ultramafic rocks and the magnetite-forming hydrothermal alteration stages of potentially fertile IOCG systems (see download link: Magnetite region grids) . <b>Download Link & Description</b> <b>•</b> GA Record (.pdf) - The report describing the method and model results. PDF document. <b>•</b> Intermediate grids (.ers) - The Australia-wide intermediate grids of elevation, gravity, and total magnetic intensity. ERMapper (.ers) format. <b>•</b> Magnetite region grids (.ers, .tif) - The Australia-wide magnetite proxy regions projected onto a 2D surface. ERMapper (.ers) and GeoTiff (.tif) format. <b>•</b> Subset_[1-17] (.sg, .den, .sus) - The Australia-wide 3D density and magnetic susceptibility models in SGrid (.sg) and UBC-GIF (.den, .sus) formats. Also includes the geological reference model surfaces (.ts). <b>•</b> Individual inversion files - GRAV3D and MAG3D input and output files for the 235 individual UBC-GIF inversions (before being recombined using cosine weighting). <b>Individual inversion input/output files for A1-V2 are available on request from clientservices@ga.gov.au - Quote eCat# 149226</b> Due to their size, the Australia-wide models have been divided into subsets (labelled 1-17) for download. Please refer to the image below for the extent of the subsets.
-
Several products were produced from the Total Magnetic Intensity (TMI) Grid of Australia 2019, seventh edition (eCat ID 131505). The grid was found to include 3 extreme, high-amplitude cultural data spikes from current and historical aluminium smelters in Victoria and Tasmania. Also, 3 data spikes of unknown origin were located in the Hunter region of NSW. These 6 data spikes were removed from the gridded data. The following products were produced from the grid with the data spikes removed: 1. Total Magnetic Intensity (TMI) edited grid (.ers) 2. Variable Reduction to Pole (VRTP) grid (.ers) 3. First Vertical Derivative (1VD) grid (.ers) 4. Half Vertical Derivative (05VD) grid (.ers) 5. Pseudo-Gravity (PGrav) grid (.ers) 6. Pseudo-Gravity, Total Horizontal Derivative (THD) grid (.ers) 7. Susceptibility (Sus) grid (.ers) 8. Variable Vertical Gradient (VBzz) grid (.ers) 9. Analytic Signal (AS; Total Gradient) grid (.ers) 10. Tilt Angle (Tilt; Phase Map) grid (.ers) 11. Tilt Angle (Tilt; Phase Map), Total Horizontal Derivative (THD) grid (.ers) 12. Upward Continuation (UC) Residual (Res) Filters (0 to 100 km; 12 grids) 13. Mutliscale Edge Detection Polygons (for each MGA zone; .shp) 14. Analytic Signal Phase Polygons (.shp) 15. GeoTiff Images (of all grids; .tif)
-
Over 8,200 line kilometres of gravity and magnetic data, acquired during the 2020 Otway Basin Seismic Program (OBSP), were combined with public domain survey and satellite data to produce seamless maps of the NW-SE trending deep-water Otway Basin. These data provide valuable information on the geometry and spatial extent of igneous rocks in the deep-water basin. While the top of basement can effectively be imaged from seismic reflection datasets onshore in the Otway Basin, it remains problematic in parts of the deep-water offshore region due to variable seismic data quality. Modelling of the magnetic line data provides an estimate of the depth to the top of basement, an important interface for understanding hydrocarbon prospectivity because it plays a key role in characterising the tectonic evolution of the basin, and thus the thermal maturation history of hydrocarbons. Magnetic modelling was performed using a profile-based curve matching technique producing a depth estimate to the top of the magnetic body that is assumed to be the top of the basement. However, this assumption is flawed where there are volcanic or igneous intra-sedimentary rocks in the basin, as is the case for the Otway Basin where the interpretation of seismic reflection data shows highly reflective events corresponding to igneous features. In most parts of the basin, the modelling results show two layers: a shallow layer (depths < 1000m) corresponding to near surface volcanics, and a deeper layer (depths > 1000m) attributed to the top of the magnetic basement. Magnetic basement shows some similarities with basement picked on seismic reflection data, though in some areas the magnetic basement is shallower. The results also show that the depth to basement is not well resolved in areas with abundant intra-sedimentary igneous rocks. Further investigation is needed in such areas. Presented at the 2024 Australian Society of Exploration Geophysicists (ASEG) Discover Symposium
-
<div>This document defines the technical standards set by Geoscience Australia for the acquisition, processing and supply of airborne magnetic, horizontal magnetic gradient and radiometric (gamma-ray spectrometric) data. The technical standards cover the requirements for equipment, calibrations, quality control checks, reporting and data formats for airborne surveys.</div><div><br></div><div><br></div><div><strong>Table of Contents</strong></div><div><br></div><div>Attachment 1A – Data Acquisition and Processing</div><div><br></div><div>1 Aircraft</div><div>2 Flight and Tie Lines</div><div>3 Global Navigation Satellite System (GNSS)</div><div>4 Parallax Correction</div><div>5 Altimeter</div><div>6 Barometer</div><div>7 Digital Elevation Model</div><div>8 Magnetic System Equipment</div><div>9 Magnetic Gradient System Equipment</div><div>10 Magnetic / Gradient Calibration and Quality Tolerances</div><div>11 Magnetic Base Station (Diurnal Monitoring)</div><div>12 Magnetic Data Reduction</div><div>13 Magnetic Gradient Data Reduction</div><div>14 Radiometric System Equipment</div><div>15 Radiometric Calibration and Quality Tolerances</div><div>16 Radiometric Data Reduction</div><div><br></div><div>Attachment 1B – Reporting and Data Supply</div><div><br></div><div>1 General</div><div>2 Calibration Report</div><div>3 Daily Acquisition Report</div><div>4 Weekly Acquisition Report</div><div>5 Operations and Processing Summary Report</div><div>6 Supply Schedule</div><div><br></div><div>Attachment 1C – Data Formats</div><div><br></div><div>1 General</div><div>2 Point-Located Data Files</div><div>3 Definition Files</div><div>4 Description Files</div><div>5 Raw-Edited Magnetic Data File</div><div>6 Reduced Magnetic Data File</div><div>7 Diurnal Magnetic Data File</div><div>8 Raw-Edited Magnetic Gradient Data File</div><div>9 Reduced Magnetic Gradiometry Data File</div><div>10 Raw-Edited Radiometric Data File</div><div>11 Reduced Radiometric Data File</div><div>12 Gridded Data Files</div><div>13 Image Enhanced GeoTIFF Files