Earth Observation
Type of resources
Keywords
Publication year
Distribution Formats
Scale
Topics
-
Band ratio: B3/B2 Blue is low content Red is high content Use this image to help interpret the amount of "obscuring/complicating" green vegetation cover.
-
The National Spectral Database (NSD) houses data from Australian remote sensing scientists. The database includes spectra covering targets as diverse as mineralogy, soils, plants, water bodies and various land surfaces. Currently the database holds spectral information from multiple locations across the country and as the collection grows in spatial / temporal coverage, the NSD will service continental scale validation requirements of the Earth observation community for satellite-based measurements of surface reflectance. <b>Value:</b> Curated spectral data provides a wealth of knowledge to remote sensing scientists. For other parties interested in calibration and validation (Cal/Val) of surface reflectance products, the Geoscience Australia (GA) Cal/Val dataset provides a useful resource of ground-truth data to compare to reflectance captured by Landsat 8 and Sentinel 2 satellites. The Aquatic Library is a robust collection of Australian datasets from 1994 to present time, primarily of end-member and substratum measurements. The University of Wollongong collection represents immense value in end-member studies, both terrestrial and aquatic. <b>Scope:</b> The NSD covers Australian data including historical datasets as old as 1994. Physical study sites encompass locations around Australia, with spectra captured in every state. <b>Data types:</b> - Spectral data: raw digital numbers (DN), radiance and reflectance. - From spectral bands VIS-NIR, SWIR1 & SWIR2: wavelengths 350nm - 2500nm collected with instruments in the field or lab setting. Contact for further information: NSDB_manager@ga.gov.au
-
This collection contains processing environments and code repositories created by Geoscience Australia used to generate National Earth and Marine Observations products.
-
This collection contains raw and ancillary information used to generate Geoscience Australia data products.
-
1. Band ratio: B1/B4 Blue is low abundance, Red is high abundance (potentially includes carbon black (e.g. ash), magnetite, Mn oxides, and sulphides in unoxidised envornments Useful for mapping: (1) magnetite-bearing rocks (e.g. BIF); (2) maghemite gravels; (3) manganese oxides; (4) graphitic shales. Note 1: (1) and (4) above can be evidence for "reduced" rocks when interpreting REDOX gradients. Combine with AlOH group Content (high values) and Composition (high values) products, to find evidence for any invading "oxidised" hydrothermal fluids which may have interacted with reduced rocks evident in the Opaques index product.
-
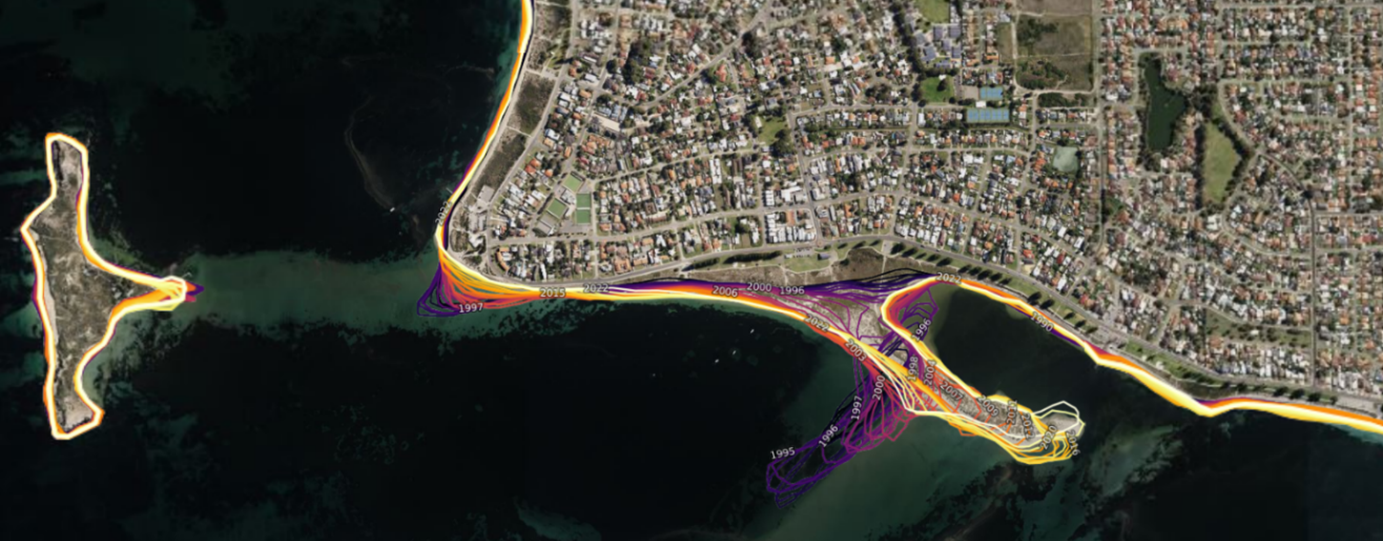
<div>This document steps educators and students through some of the uses of the satellite data on the Digital Earth Australia (DEA) Portal, with a particular focus on changes to landscapes and coasts over time. Instructions and questions are provided so educators and students can explore the data sets as they work their way through the document. The document also gives a brief background on how satellites operate and how they capture imagery.</div><div><br></div>
-
Earth Observations over Antarctica and the Southern Ocean are critical for understanding changes in the cryosphere, ecosystems and oceans through time. Our ability to observe Antarctica systematically at a continental scale is constrained by difficulties accessing, storing and pre-processing satellite imagery prior to analysis. Some of these challenges are unique to the Antarctic environment, where factors such as cloud masking, reflectivity, prolonged periods of darkness and atmospheric differences in water vapour, aerosol and signal scattering mean that corrections applied to satellite data in other regions of the world aren’t representative of Antarctic conditions. A new collaboration between Geoscience Australia and the Australian Antarctic Division, Digital Earth Antarctica, aims to improve access to corrected continental scale satellite data through use of Open Data Cube technology. This initiative builds on work in the international community in developing Open Data Cube platforms, which have been applied in the development of Digital Earth Australia and Digital Earth Africa. The Digital Earth Antarctica platform will provide open access to analysis ready time-series data that has been corrected and validated for Antarctic conditions. It will focus primarily on data from Landsat (optical), Sentinel-1 (synthetic aperture radar) and Sentinel-2 (optical), with other sensors to be added as the capability expands. Digital Earth Antarctica is an ambitious project that will work alongside other international efforts to enhance the accessibility of quality Antarctic Earth Observations. Abstract/Poster presented at the 2023 New Zealand - Australia Antarctic Science Conference (NZAASC)
-
1. Band ratio: B2/B1 Blue-cyan is goethite rich, Green is hematite-goethite, Red-yellow is hematite-rich (1) Mapping transported materials (including palaeochannels) characterised by hematite (relative to geothite). Combine with AlOH composition to find co-located areas of hematite and poorly ordered kaolin to map transported materials; and (2) hematite-rish areas in drier conditions (eg above the water table) whereas goethite-rich in wetter conditions (eg at/below the water or areas recently exposed). May also be climate driven.
-
This collection contains Earth Observations from space created by Geoscience Australia. This collection specifically is focused on data and derived data from the European Commission's Copernicus Programme. Example products include: Sentinel-1-CSAR-SLC, Sentinel-2-MSI-L1C, Sentinel-3-OLCI etc.
-
This collection contains Earth Observations from space created by Geoscience Australia. This collection specifically is focused on RADAR and Synthetic Aperture Radar (SAR) data. Example products include: ALOS SLC, ENVISAT raw etc.