From 1 - 10 / 186
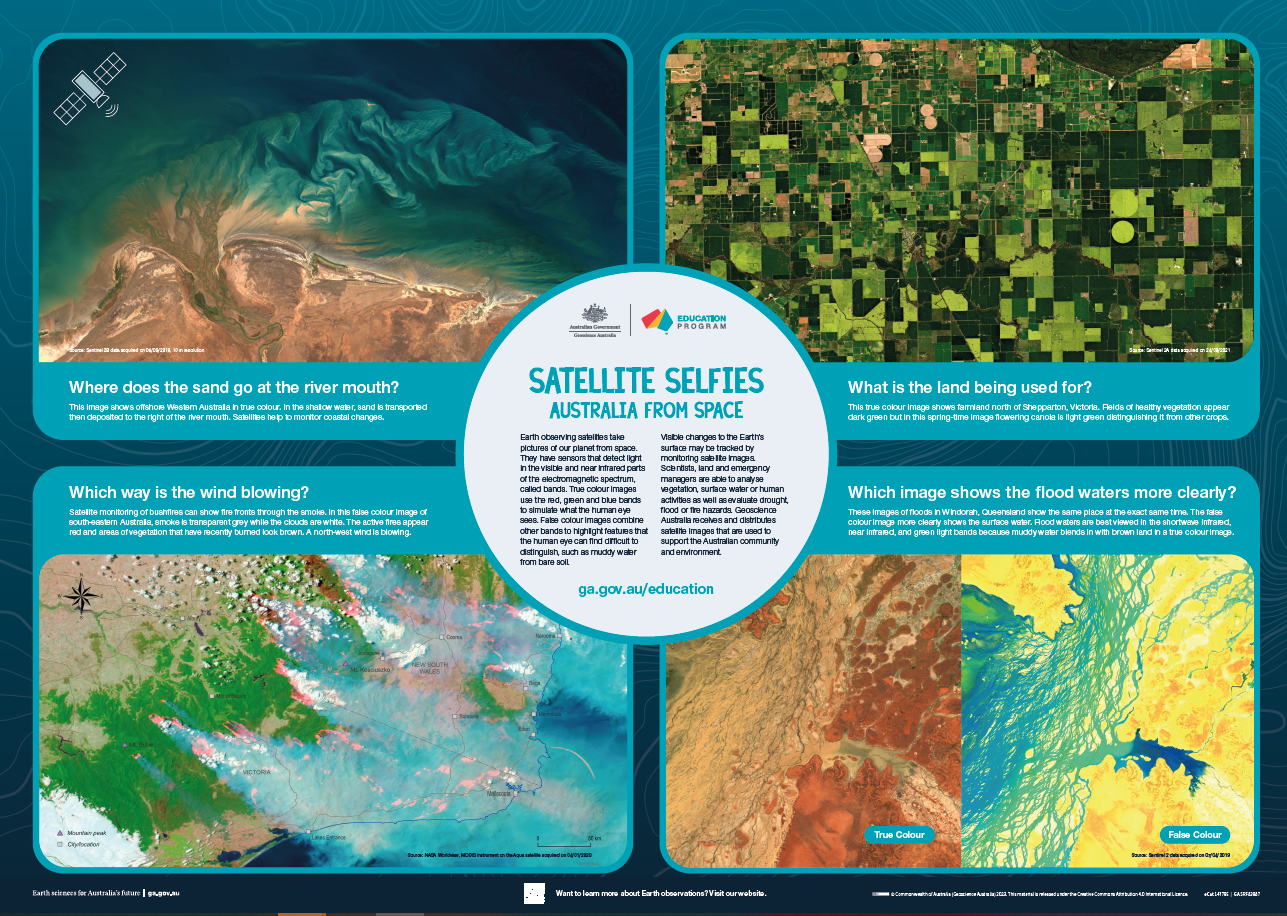
  • <div>The A1 poster incorporates 4 images of Australia taken from space by Earth observing satellites. The accompanying text briefly introduces sensors and the bands within the electromagnetic spectrum. The images include examples of both true and false colour and the diverse range of applications of satellite images such as tracking visible changes to the Earth’s surface like crop growth, bushfires, coastal changes and floods. Scientists, land and emergency managers use satellite images to analyse vegetation, surface water or human activities as well as evaluate natural&nbsp;hazards.</div>

  • Salt lakes, also known as playa lakes, are a common feature of the Australian landscape, and are a strong indicator of our current and past climates. Despite their abundance they have not been extensively studied in Australia, with little research undertaken since the early benchmark work of the 1970s - 1980s (e.g. Bowler, 1971, 1981) which largely focussed on geomorphologic evolutionary patterns and trends. Notwithstanding, salt lakes contain some of the highest levels biological endemism in Australia (DeDecker, 1983) and their unique, and commonly extreme, chemistry offers the potential for distinctive saline mineralisation and potentially economic concentrations of Li, K, B, REEs, Br and U (e.g. Butt et al. 1984; Nissenbaum, 1993; Orris, 2011).

  • The regional assessment of hydrocarbon seepage is built around a combination of Radarsat and ERS Synthetic Aperture Radar (SAR) data, acquired during 1998 and 1999, as part of a collaborative project between AGSO - Geoscience Australia, Nigel Press & Associates, Radarsat International and AUSLIG (specifically the Australian Centre for Remote Sensing). In total, 55 Radarsat Wide 1 Beam Mode scenes and 1 ERS scene from the Great Australian Bight (GAB) region were analysed. The data were integrated with regional geological information, and other hydrocarbon migration/seepage indicators such as reprocessed and reinterpreted legacy Airborne Laser Fluorosensor (ALF) data, to provide an assessment of the possible charge characteristics of the region. The results of the study suggest that active, though areally restricted, liquid hydrocarbon seepage is occurring within the Bight Basin. The majority of seepage slicks occur along the outer margin of the major depocentre, the Ceduna Sub-basin, in areas where significant Late Tertiary to Recent faulting extends to the seafloor. Very little evidence of seepage was observed on the SAR data above the main depocentre, which is an area of minimal Late Tertiary to Recent faulting. Reprocessed ALF data reveal three main areas with relatively dense fluors. Although they are not directly coincident with locations of seepage interpreted from SAR data, their distribution support the pattern of preferred leakage along the basin margins. Integration of regional geological models with the results of this study suggests that structural features related to active tectonism have focused laterally migrating hydrocarbons to produce active seepage at specific locations in the basin. Where these features are absent, seepage may be passive and/or be governed by long distance migration to points of seal failure. Together with oil and gas shows in exploration wells, observations from this study provide further evidence that liquid hydrocarbons have been generated in the Great Australian Bight.

  • Geoscience Australia, ACRES distribute Landsat Multispectral Scanner (MSS), Thematic Mapper (TM) and Enhanced Thematic Mapper Plus (ETM+) data for a series of epochs or time frames covering Australia. The first epoch is 1972. These data have been produced and provided by the Australian Greenhouse Office (AGO). AGO use the data in their National Carbon Accounting System for monitoring land clearing and revegetation. This data is only available through ACRES and ACRES Landsat Distributors, and not through the AGO. More information is available at <a href="http://www.ga.gov.au/acres/prod_ser/agosuite.jsp">http://www.ga.gov.au/acres/prod_ser/agosuite.jsp</a> This data is available in 1:1M tiles or as a full continental Mosaic. Tiles areas are available at: <a href="http://www.ga.gov.au/acres/prod_ser/agotilemap.jsp">http://www.ga.gov.au/acres/prod_ser/agotilemap.jsp</a>

  • Geoscience Australia, ACRES distribute Landsat Multispectral Scanner (MSS), Thematic Mapper (TM) and Enhanced Thematic Mapper Plus (ETM+) data for a series of epochs or time frames covering Australia. The first epoch is 1972. These data have been produced and provided by the Australian Greenhouse Office (AGO). AGO use the data in their National Carbon Accounting System for monitoring land clearing and revegetation. This data is only available through ACRES and ACRES Landsat Distributors, and not through the AGO. More information is available at <a href="http://www.ga.gov.au/acres/prod_ser/agosuite.jsp">http://www.ga.gov.au/acres/prod_ser/agosuite.jsp</a> This data is available in 1:1M tiles or as a full continental Mosaic. Tiles areas are available at: <a href="http://www.ga.gov.au/acres/prod_ser/agotilemap.jsp">http://www.ga.gov.au/acres/prod_ser/agotilemap.jsp</a>

  • Geoscience Australia, ACRES distribute Landsat Multispectral Scanner (MSS), Thematic Mapper (TM) and Enhanced Thematic Mapper Plus (ETM+) data for a series of epochs or time frames covering Australia. The first epoch is 1972. These data have been produced and provided by the Australian Greenhouse Office (AGO). AGO use the data in their National Carbon Accounting System for monitoring land clearing and revegetation. This data is only available through ACRES and ACRES Landsat Distributors, and not through the AGO. More information is available at <a href="http://www.ga.gov.au/acres/prod_ser/agosuite.jsp">http://www.ga.gov.au/acres/prod_ser/agosuite.jsp</a> This data is available in 1:1M tiles or as a full continental Mosaic. Tiles areas are available at: <a href="http://www.ga.gov.au/acres/prod_ser/agotilemap.jsp">http://www.ga.gov.au/acres/prod_ser/agotilemap.jsp</a>

  • The product SAR.SLC is a single look complex digital image generated from raw SAR data using up-to-date auxiliary parameters. The image, projected on sland range, referred to as 'quarter scene' or quadrant corresponds to approximately one half (range) by one half (azimuth) of a full scence image. The ESA SAR.SLC format is based on the general definition of the SAR CEOS format (ref. ER-IS-EPS-GS-5902).

  • ACRES acquired SPOT 2 satellite images over the Namoi River, between the towns of Walgett and Wee Waa in December 1997 and November 2000. The November 2000 image consists of 12 scenes in which floodwaters, peaking at 8 metres, inundating the region are visible as green and light blue. Extensive flooding is evident. The December 1997 image shows the area of the Namoi River without floodwaters. The Namoi River catchment area is more than 350 kilometres long and stretches from Walcha in the east to Walgett in the west. Other river systems in the region include the Gwydir, Castlereagh, Hunter, Macquarie, Macleay, Manning, Culgoa and Condamine. You can find these rivers on Geoscience Australia's interactive Map of Australia.

  • On 8 March 2014, the Boeing 777-200ER aircraft registered as Malaysia Airlines 9M-MRO and operating as flight MH370 (MH370) disappeared from air traffic control radar after taking off from Kuala Lumpur, Malaysia on a scheduled passenger service to Beijing, China with 227 passengers and 12 crew on board. After analysis of satellite data it was discovered that MH370 continued to fly for over six hours after contact was lost. All the available data indicates the aircraft entered the sea close to a long but narrow arc of the southern Indian Ocean. On 31 March 2014, following an extensive sea and air search, the Malaysian Government accepted the Australian Government’s offer to take the lead in the search and recovery operation in the southern Indian Ocean in support of the Malaysian accident investigation. On behalf of Australia, the Australian Transport Safety Bureau (ATSB) coordinated and led the search operations for MH370 in the southern Indian Ocean. Geoscience Australia (GA) provided advice, expertise and support to the ATSB in sea floor mapping (bathymetric survey) and the underwater search. In March 2017 GA was subsequently asked by the ATSB to provide advice and scientific expertise in the analysis of satellite imagery (PLEIADES 1A) (Source: French Military Intelligence Service © CNES) for the detection of possible non-natural objects. All enquiries regarding the overall search should be directed to the ATSB (atsbinfo@atsb.gov.au).

  • Geoscience Australia, ACRES distribute Landsat Multispectral Scanner (MSS), Thematic Mapper (TM) and Enhanced Thematic Mapper Plus (ETM+) data for a series of epochs or time frames covering Australia. The first epoch is 1972. These data have been produced and provided by the Australian Greenhouse Office (AGO). AGO use the data in their National Carbon Accounting System for monitoring land clearing and revegetation. This data is only available through ACRES and ACRES Landsat Distributors, and not through the AGO. More information is available at <a href="http://www.ga.gov.au/acres/prod_ser/agosuite.jsp">http://www.ga.gov.au/acres/prod_ser/agosuite.jsp</a> This data is available in 1:1M tiles or as a full continental Mosaic. Tiles areas are available at: <a href="http://www.ga.gov.au/acres/prod_ser/agotilemap.jsp">http://www.ga.gov.au/acres/prod_ser/agotilemap.jsp</a>